Hello there! Let's talk about the metrics that matter. These aren't just numbers on a spreadsheet; they're the vital signs of your business. They tell you the story of your customer's journey and are some of the most reliable predictors of future revenue. We're talking about data that goes far beyond surface-level stats to reveal acquisition efficiency, how well you activate new users, your ability to keep them coming back, and ultimately, your profitability.
Why Most SaaS Companies Track the Wrong Numbers

It’s incredibly easy to get lost in a sea of data. Far too many SaaS companies get a sugar rush from numbers that look great in a board meeting but do absolutely nothing to drive real, sustainable growth. This is the seductive trap of vanity metrics—things like total sign-ups, social media followers, or raw page views. They feel good, but they don't tell you much about the health of your business.
Think of it like being the captain of a ship. Relying on vanity metrics is like using a compass that only points to the biggest, fluffiest cloud in the sky. Sure, it looks impressive, but you’re just drifting. You’re busy, but you’re not actually navigating toward profitable shores.
The Problem With Vanity Metrics
The real danger with these misleading numbers is their complete lack of context. They aren't actionable. A huge spike in website traffic is exciting, but what if none of those visitors are a good fit for your product? A flood of free trial sign-ups looks like a massive win, but what if 95% of those users never log in again after the first day?
These metrics tell you that something happened, but they rarely tell you why it happened or what to do next.
True growth comes from understanding the specific, actionable metrics that reveal the health of your customer journey. These are the numbers that connect directly to revenue and customer satisfaction, acting as a reliable GPS for your strategic decisions.
To steer clear of this common pitfall, you have to shift your focus from what feels good to what actually moves the needle. It's about knowing which numbers lead to real growth, like the ones covered in this list of the 8 Marketing KPIs B2B Companies Must Track.
This simple table breaks down the difference.
Vanity Metrics vs Actionable Metrics
| Vanity Metric (Feels Good) | Actionable Metric (Drives Growth) | Why It Matters for Decisions |
|---|---|---|
| Total Website Visitors | Visitor-to-Lead Conversion Rate | Tells you if your marketing message and site design are actually compelling your ideal customers to act. |
| Total Trial Sign-ups | Activation Rate (% of users reaching "Aha!" moment) | Shows if new users are experiencing the core value of your product, which is the first step toward retention. |
| Social Media Likes/Followers | Engagement Rate (comments, shares, saves) | Measures if your content is truly resonating and building a community, not just passively consumed. |
| Time on Page | Feature Adoption Rate | Reveals if users are just browsing or are actively using the sticky features that solve their problems and lock them in. |
Focusing on the right-hand column is how you start making decisions that lead to growth, not just activity.
A Better Framework for Growth
So, how do you find your true north? A great way is by adopting a framework that measures the entire customer lifecycle, not just the flashy parts at the beginning. A modern spin on the classic "Pirate Metrics" (AARRR) gives you a powerful lens for understanding your business.
This model zeroes in on the crucial stages every customer goes through:
- Acquisition: How are people discovering you?
- Activation: Are they getting value right away?
- Retention: Are they sticking around for the long haul?
- Revenue: How are you turning usage into dollars?
- Referral: Do they love your product enough to tell others?
When you organize your thinking this way, you move beyond guesswork. Instead of just counting website visitors, you start measuring the cost to acquire a profitable customer. Instead of just celebrating sign-ups, you obsess over how many new users reach that critical "Aha!" moment.
This guide will walk you through each of these stages, showing you exactly which numbers to watch to build a truly sustainable and market-leading SaaS business.
Measuring Your Customer Acquisition Funnel

Think of your acquisition funnel as the front door to your business. It's easy to get caught up in just driving more traffic, but the real game isn't about getting more people through the door—it's about getting the right people through as efficiently as possible.
That means we need to look past simple visitor counts and start focusing on the numbers that reveal the true health of your acquisition engine.
The first, most fundamental question you have to answer is: what does it actually cost us to win a new customer? This is where Customer Acquisition Cost (CAC) becomes your north star. Put simply, CAC is your total sales and marketing spend divided by the number of new customers you brought in over a specific period.
A low CAC might look like a win on a spreadsheet, but it can be a trap. If you're acquiring a flood of "cheap" customers who don't actually fit your ideal profile, they're likely to churn out just as quickly as they came in. Your goal isn't the lowest possible CAC; it's an optimal CAC that delivers high-quality customers who will stick around for the long haul.
From Interest to Intent
Another classic friction point in the acquisition journey is the handoff from marketing to sales. It's where countless promising leads get lost in translation. This is precisely why you need to be tracking your Marketing Qualified Lead (MQL) to Sales Qualified Lead (SQL) conversion rate.
An MQL is someone who's shown interest—maybe they downloaded an ebook or attended a webinar. An SQL, on the other hand, is a lead the sales team has vetted and confirmed is a legitimate potential buyer. A healthy MQL-to-SQL rate is a sign of a well-oiled machine, showing that marketing and sales are perfectly aligned on who your ideal customer is. If that rate is low, it’s a blaring alarm that you’ve got a disconnect that's burning time and cash.
The most powerful acquisition strategies don't just fill the top of the funnel; they attract users who are primed for success from day one. This initial alignment is the foundation for healthy retention and revenue down the line.
Of course, how you find these high-intent leads matters immensely. The sharpest B2B marketers know that organic search is an absolute powerhouse. In fact, a 2023 Conductor study found that 67.6% of all trackable website traffic comes from search engines (both organic and paid), with organic search being the dominant channel. This is exactly why building a robust SEO and content program is one of the most sustainable ways to lower your CAC while attracting high-quality leads.
The All-Important First Step: Activation
Once a user signs up, the clock is officially ticking. This is the Activation stage—that make-or-break moment when a new user experiences your product's core value for the very first time. It's their "Aha!" moment.
A user who activates is exponentially more likely to become a paying, long-term customer. Counting sign-ups is a vanity metric; counting activations is a direct predictor of future revenue.
Every SaaS product has its own unique activation milestone. For example:
- For a cybersecurity SaaS: The user successfully sets up their first security policy.
- For a project management tool: The user creates their first project and invites a team member.
- For an email marketing platform: The user imports their contact list and sends their first campaign.
Let's stick with that cybersecurity SaaS. They might see 1,000 new sign-ups in a month and pat themselves on the back. But when they dig in, they discover that only 150 of those users actually configured their first security policy within 24 hours. That 15% activation rate is the real story. It's the true measure of their onboarding success and one of the metrics that matter most.
By zeroing in on this number, the product team gets a crystal-clear roadmap. They know they need to improve the setup wizard, add better in-app guidance, or offer proactive support to get more users to that "Aha!" moment, faster. For more insights on building a successful foundation for growth, you might be interested in our guide on marketing strategy.
The Real Engine of SaaS Growth: Retention and Revenue

Winning a new customer feels great, there’s no doubt about it. But that victory is just the beginning of the story.
Think of your SaaS business as a bucket you’re trying to fill with water. Every new customer is a splash of water you pour in. But if that bucket is full of holes, you’ll spend all your time and energy just trying to keep it from running dry. This is where retention becomes the true engine of sustainable growth.
Those holes in the bucket? That's Customer Churn. It’s the percentage of customers who cancel their subscriptions over a set period. It’s one of the most honest metrics you can track because it shows exactly how well your product is delivering on its promise long after the initial sale. A high churn rate is a five-alarm fire—it’s a clear sign that something is broken, draining your resources and sabotaging growth before it even has a chance to compound.
While customer churn tells you how many logos just walked out the door, Revenue Churn tells you how much money walked out with them. The distinction is critical. Losing ten small, free-tier customers might sting a little, but losing one major enterprise client can sink a whole quarter. Revenue churn gives you that financial clarity.
The Holy Grail: Negative Revenue Churn
Now, what if your existing customers actually started spending more over time? They upgrade their plans, add more seats, or buy new add-on features. This is what we call expansion revenue.
When your expansion revenue from existing customers is greater than the revenue you lose from downgrades and cancellations, something magical happens. You’ve hit negative revenue churn.
This means your business grows financially even if you don’t sign a single new customer. It’s the ultimate sign of a healthy, sticky product with a powerful growth flywheel built right in. It proves customers are getting so much value that they're not just sticking around—they’re investing more. They are effectively patching the leaks in your bucket for you and helping you fill it faster.
Negative revenue churn is the single most powerful indicator of a sustainable SaaS business model. It transforms your existing customer base from a leaky bucket into a compounding growth engine.
For a deeper look at practical strategies that keep customers happy and locked in, it's worth learning how to reduce customer churn and protect your hard-earned revenue.
Understanding Customer Lifetime Value
To really get a grip on your business's economics, you have to know what a customer is truly worth over their entire relationship with you. That's their Customer Lifetime Value (LTV). A high LTV means customers are happy, they're sticking around for a long time, and they're paying you consistently. That’s the foundation of a profitable company.
Calculating LTV can get incredibly complex, but a simple, back-of-the-napkin formula is incredibly revealing:
LTV = (Average Revenue Per Account) / (Customer Churn Rate)
This formula perfectly illustrates the powerful relationship between retention and value. If you can cut your churn rate in half, you literally double the lifetime value of every single customer you acquire from that point forward. It’s why focusing on retention gives you such incredible leverage.
The Golden Ratio: LTV to CAC
Finally, let's bring it all together. You know how much it costs to acquire a customer (CAC), and now you know how much that customer is worth over time (LTV). The relationship between these two metrics is arguably the most important signal of health for any SaaS business.
The LTV:CAC ratio tells you the return on investment for your entire sales and marketing machine. For example, if your LTV is $3,000 and your CAC is $1,000, your LTV:CAC ratio is 3:1.
So what does a healthy ratio actually look like?
- 1:1 or less: You are losing money with every new customer. The bucket is leaking faster than you can fill it. This model is broken and needs an immediate fix.
- 3:1: This is widely considered the sweet spot. You're generating a solid return on your acquisition spend and have a healthy, scalable business.
- 5:1 or higher: This is fantastic! But it might also be a sign that you're underinvesting in marketing and sales. You could be growing even faster if you pressed the accelerator.
Mastering these retention and revenue metrics is what separates the companies that scale from those that stagnate. They force you to look beyond simply filling the funnel and start focusing on building a product and experience that customers genuinely value. Learn more about bringing your product to market with a solid foundation in our guide to product marketing.
Is Your Growth Healthy? A Look at Product Health and Profitability
Knowing your retention and revenue numbers tells you that your business model is working. But to understand why it's working—and how to keep it working—you need to dig a little deeper.
This is where the metrics that separate the fast-growing SaaS companies from the ones that eventually flame out come into play. These numbers aren't just for board meetings; they reveal the true health of your product and the fundamental profitability of your business model.
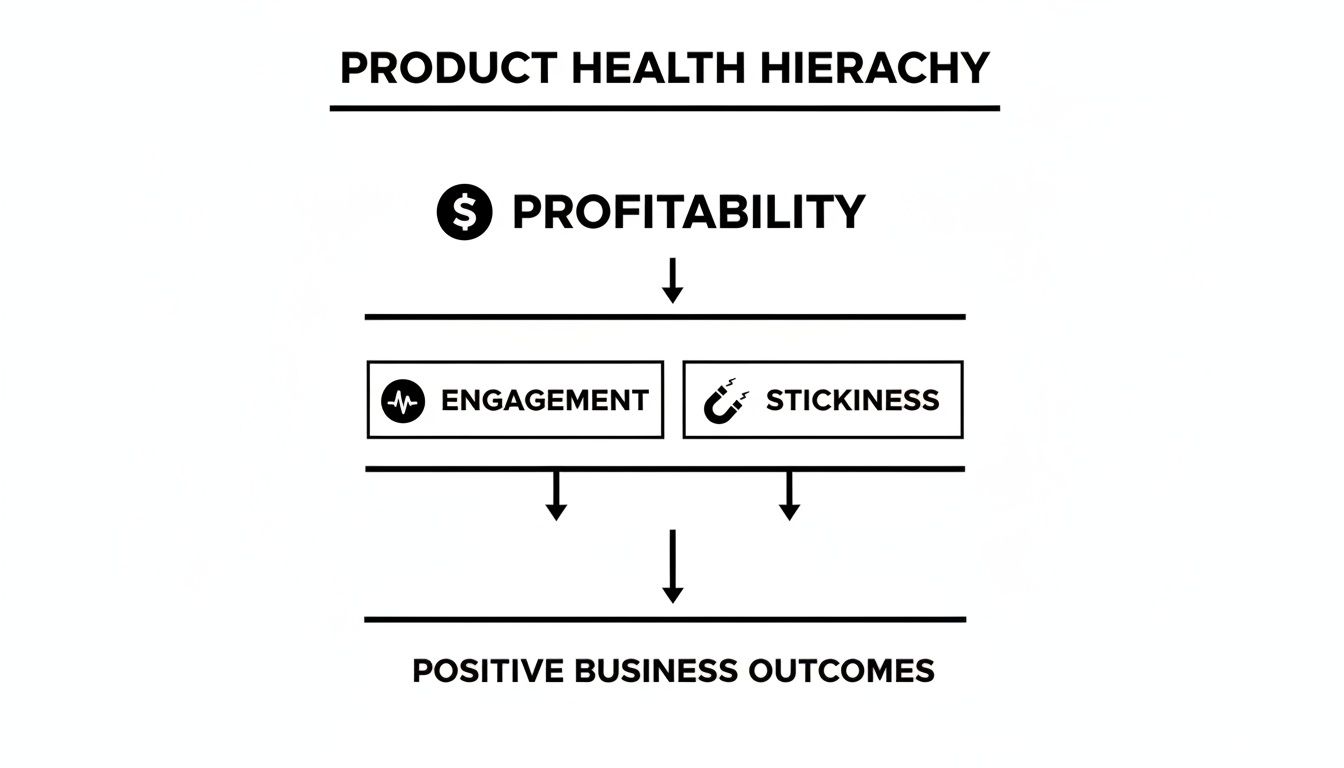
We're going to focus on two critical areas: Engagement and Unit Economics. Think of engagement as the leading indicator of retention, and unit economics as the acid test for whether you’re actually making money on each customer you sign.
How Sticky is Your Product? A Guide to Engagement Metrics
High engagement is the holy grail. It’s the clearest sign that your product has woven itself into a customer's daily workflow. When people aren't just logging in but are actively using your key features to solve real problems, you've built something valuable. And happy, engaged customers simply don't churn.
But "engagement" itself is too vague to be useful. To make it something you can actually improve, you have to track the specific metrics that quantify how "sticky" your product really is.
Here are a few of the most important ones to get on your dashboard:
- DAU/MAU Ratio: This is your Daily Active Users divided by your Monthly Active Users, and it's a potent measure of stickiness. A ratio of 50% or higher is considered elite for B2B SaaS, as it means the average user is active in your product more than 15 days a month. That’s a habit.
- Feature Adoption Rate: Don't just celebrate logins; track what people are actually doing inside your product. This metric shows you the percentage of users who have tried a specific feature. It’s your best tool for identifying which features deliver the most value and which ones might need a better onboarding flow or a marketing push.
- Session Duration and Frequency: How long are people sticking around, and how often are they coming back? Honestly, I care a lot more about frequency than duration. A user who logs in for five minutes every single day is forming a much stronger habit than someone who logs in for an hour once a month.
Engagement is not a soft metric. It’s a direct predictor of future revenue. When you see engagement dip for a specific customer, that’s your early warning system flashing red. It’s a chance to intervene and fix the problem before they show up on your churn report.
Unpacking Your Unit Economics: Are You Actually Making Money?
Beyond how users behave, you need a painfully clear picture of whether each customer is profitable. Welcome to the world of Unit Economics. Getting this right is non-negotiable for building a business that can scale.
It all boils down to one simple, crucial question: for every dollar we spend to acquire a customer, are we making more than a dollar back from them over time?
Two metrics form the foundation here: Gross Margin and CAC Payback Period.
Gross Margin tells you how much profit you bank from your product after subtracting the direct costs of running it—things like hosting, third-party API costs, and front-line customer support. A healthy SaaS company should be shooting for a gross margin of 80% or higher.
The CAC Payback Period is even more powerful. It’s the number of months it takes to earn back the money you spent to acquire a customer in the first place. For instance, if your Customer Acquisition Cost (CAC) is $1,200 and a customer pays you $100 a month, your payback period is 12 months.
For a venture-backed SaaS, a payback period of under 12 months is the gold standard. It means your growth engine is incredibly efficient. You’re generating cash from new customers quickly, which you can then pour right back into acquiring the next cohort of users.
Your Quick Unit Economics Health Check
So, how do you know if your business model is built to last? Run this quick diagnostic.
- Is your LTV:CAC Ratio above 3:1? This is the magic number. It's the baseline for a healthy, scalable business where every customer generates at least three times what they cost to acquire.
- Is your CAC Payback Period under 18 months? You should be aiming for under 12, but anything over 18 months starts putting a serious strain on your cash flow, slowing down your growth.
- Is your Gross Margin above 75%? If it’s not, you may have a fundamental issue with your pricing or the efficiency of your service delivery that you need to address.
These final metrics connect the dots between how people use your product and the financial health of your company. They give you the complete picture, ensuring the growth you’re chasing is not only real but sustainable for the long haul.
Building a Dashboard for Every Stage and Role
A generic, one-size-fits-all dashboard is a recipe for disaster. It’s like giving every member of an orchestra the same sheet music—the result is noise, not harmony. To make data actually useful, it needs context.
What a seed-stage startup needs to track is wildly different from what a market leader focuses on. And what keeps a CEO up at night isn't the same thing a product manager obsesses over day-to-day. The real goal is to build a reporting system that creates clarity, not clutter. This means creating focused dashboards tailored to specific company stages and individual roles, ensuring everyone is pulling in the same direction and making decisions based on the right information.
Tailoring Dashboards to Your Company Stage
Your company's primary goal changes as you grow, and your core dashboard has to reflect that strategic focus. Think of a dashboard as more than just a report; it’s a public declaration of your current priorities.
Early-Stage (Pre-Product-Market Fit): Right now, your entire world revolves around validation. The only question that matters is: "Have we built something people desperately want?" Your dashboard should be stripped down to the bare essentials of user love.
- Focus: Activation Rate, Feature Adoption (for your core features), and Weekly Active User (WAU) growth.
- Why: These are the leading indicators of product-market fit. High activation and engagement are your proof that you’re solving a real, painful problem. Nothing else matters yet.
Growth-Stage (Scaling the Go-to-Market): You've found product-market fit. Great. Now it's time to step on the gas. The conversation shifts from "if" to "how efficiently." The dashboard must now measure the health and scalability of your growth engine.
- Focus: MQL-to-SQL Conversion Rate, CAC by channel, and the LTV:CAC Ratio.
- Why: These metrics tell you which acquisition channels are actually profitable and scalable. This is how you invest your resources wisely to accelerate growth without lighting money on fire.
Designing Dashboards for Key Roles
Just as your company stage dictates focus, so do individual roles. Every team needs a dashboard that answers their most pressing daily questions and empowers them to take meaningful action within their domain.
As you can see, a well-designed dashboard can distill complex data into clear, at-a-glance insights, showing you where you stand against your most important targets. Let's break down how this works for different roles in a SaaS company.
A great dashboard doesn't just present data; it tells a story. For a CEO, that story is about sustainable growth and profitability. For a product manager, it's about user love and value delivery.
For the CEO and Leadership Team
The executive view is all about the overall health and trajectory of the business. It needs to be high-level, zeroing in on the core financial and growth levers that determine long-term success. No fluff.
- Key Metrics: Monthly Recurring Revenue (MRR), LTV:CAC Ratio, CAC Payback Period, and Net Revenue Churn. For B2B execs, marketing budget as a percentage of revenue is also crucial. According to a 2023 Gartner survey, CMOs reported that marketing budgets climbed to 9.1% of total company revenue, showing renewed confidence in marketing's impact.
For the Product Manager
Product managers live and breathe the user experience. Their dashboard is a window into how customers are actually interacting with the product and whether it’s truly solving their problems.
- Key Metrics: DAU/MAU Ratio, Feature Adoption Rates, User Retention by Cohort, and customer satisfaction scores (like NPS). To get more ideas for digging into your data, check out our guide on marketing operations.
By building these tailored views, you create a system where every team member understands exactly how their work connects to the bigger picture. This is what drives strategic alignment and smarter decisions across the entire organization.
Turning Your Data Into Decisive Action
Let's be honest: data sitting on a dashboard is just potential. It’s a collection of numbers that looks impressive, but its real value is only unlocked when it makes you do something—spark a new experiment, inspire a change, or help you dodge a bullet. The goal isn't just to track the metrics that matter, but to use them to make smarter, faster decisions that actually move the needle.
This is all about shifting from passive observation to active problem-solving. When a key metric flashes red, you need a clear, repeatable process for figuring out what’s wrong and how to fix it. It's about building a culture where data is the starting point for a conversation, not just the final slide in a report.
Think of your dashboard as your company’s early warning system. An unexpected spike or a sudden dip in a core metric is a loud signal that something has shifted—either in your customer's world or in your own strategy. Your job is to put on your detective hat and use the data to ask the right questions until you find the truth.
A Simple Troubleshooting Framework
When a metric veers off course, the worst thing you can do is jump to conclusions. Instead, start with a simple diagnostic framework to guide your investigation. Let’s walk through two classic scenarios that keep SaaS leaders up at night and map out the first steps to take.
Scenario 1: Your Customer Acquisition Cost (CAC) is Creeping Up
You check the numbers and your CAC is suddenly 20% higher than last quarter. Panic is one option. A better one is to investigate methodically.
- Step 1: Analyze Channel Performance. Is the increase happening everywhere, or is it isolated to one or two channels? A spike in your paid search CAC might point to new competition driving up bids. A rise in content-driven CAC could mean your SEO efforts are losing traction.
- Step 2: Review Your Funnel Conversions. Look at the smaller steps within your acquisition funnel. Has your landing page conversion rate dropped? Is your MQL-to-SQL rate taking a nosedive? A new bottleneck may have appeared that's forcing you to spend more to get the same result.
- Step 3: Audit Recent Changes. What did your team change in the last month? Did you launch a new ad campaign, tweak the website messaging, or enter a new market? More often than not, the cause is directly tied to a recent strategic shift.
Scenario 2: Your Monthly Churn Rate Just Spiked
A sudden jump in churn is a five-alarm fire for any SaaS business. But before you start overhauling your entire product, you need to pinpoint who is leaving and why.
The most valuable insights almost always come from segmenting your data. A high-level churn number hides the real story. The truth is in the details of which customer segments are actually walking away.
Start by digging into the specifics of the customers who churned this month.
- Identify the Cohort: Are the customers leaving mostly new users who just signed up in the last 30 days? Or are they long-time power users? High early-stage churn points to a weak onboarding experience, while losing veterans suggests a problem with your product’s evolving value or a new competitor swooping in.
- Analyze Engagement Data: What did their product usage look like in the weeks before they cancelled? Did their session frequency drop off a cliff? Did they stop using a feature they once loved? A dip in engagement is the number one leading indicator of churn and gives you a clear area to investigate.
- Gather Qualitative Feedback: If you don't have an automated exit survey, now is the time to build one. Even better, have your customer success team personally reach out to a few of these churned accounts. The direct, unfiltered feedback you get is often the most powerful clue you'll find.
A Few Lingering Questions
Diving into the world of SaaS metrics can feel like learning a new language. It’s natural to have questions. Here are some of the most common ones we hear, along with some straight-talk answers to help you cut through the noise.
What’s the One Metric an Early-Stage SaaS Should Obsess Over?
If you're just starting out, the single most critical metric is customer retention. It's easy to get caught up in the thrill of new sign-ups, but if customers are walking out the back door as fast as they're coming in, you have a fundamental problem. You haven't found product-market fit.
Think of it this way: strong retention is the ultimate proof that your product actually solves a real problem and delivers undeniable value. It’s the solid foundation you need before you can even think about building anything else. The best way to lock in that retention early on? Go all-in on user activation and engagement.
With So Many Metrics, How Do I Know Where to Focus?
The right metrics for you depend entirely on where your business is right now and what you're trying to achieve. A great way to find clarity is to use the 'One Metric That Matters' (OMTM) framework. It forces you and your team to identify the single biggest challenge or opportunity in front of you.
For instance:
- Haven't quite found product-market fit? Your OMTM might be the number of weekly active users.
- Struggling to get users to pay? Your focus could shift to the trial-to-paid conversion rate.
This isn't about ignoring everything else forever. It's about rallying the entire company around one clear, shared objective for a specific period of time. It's a powerful way to eliminate distractions and get everyone pulling in the same direction.
How Often Should I Be Looking at My Metrics Dashboard?
This is a great question, and the answer is: it depends. Not all data deserves the same level of attention.
A good rule of thumb is to break your metrics into two buckets:
- Leading Indicators: These are your canaries in the coal mine—things like daily active users, new trial sign-ups, and feature adoption. They give you a real-time pulse on the business and should be monitored daily or weekly.
- Lagging Indicators: These metrics, like Customer Lifetime Value (LTV), revenue churn, and CAC payback period, tell the story of past performance. They’re crucial for understanding long-term health and are best reviewed on a monthly or quarterly basis.
Your main leadership dashboard, which should have a mix of both, is something you'll want to glance at weekly to catch any developing trends. This rhythm lets you stay nimble without getting whiplash from every tiny daily blip, saving the deep strategic dives for your monthly reviews.
At Mick-Mar Inc., our whole game is helping B2B SaaS companies turn raw data into smart, decisive action. We partner with you to build a marketing roadmap that focuses squarely on the initiatives that will actually move the needle for your business.