Think of a marketing agency report as the story of your investment. It’s not just a document packed with numbers; it’s a strategic tool that turns complex marketing data into a clear, understandable narrative about performance, insights, and what comes next.
A great report does more than just show what happened. It’s designed to demonstrate the real value of your marketing efforts, justify the budget, and get both the agency and the client on the same page, driving toward shared goals.
Beyond Data Dumps: What Marketing Reports Really Do

Let's be real—no one loves getting a spreadsheet crammed with raw numbers. For too long, marketing reports have felt like a chore. But a well-crafted report isn't a data dump; it’s the vital story of a campaign’s journey.
I like to think of it as a ship's logbook. The captain doesn't just jot down coordinates. They note the weather, the challenges faced, and new discoveries. That logbook isn’t just a record of where the ship has been; it's the intelligence they need to plot a better, safer course for the future.
A Foundation Built on Clarity and Trust
That's exactly what great marketing agency reports do. They build a solid foundation of trust between an agency and its client by turning a sea of confusing metrics into a clear story of wins, hurdles, and smart adjustments.
This is non-negotiable when you're working with SaaS clients. They live and breathe results and need to see a direct line from marketing activity to business growth. For them, a report has to answer the big questions:
- Is our investment paying off? The report must clearly connect marketing spend to tangible results like leads, free trials, and new customers.
- What did we learn? It needs to pull out the key takeaways from the campaign, explaining what worked, what didn't, and the "why" behind it all.
- Where are we going next? The best reports always look ahead. They use past data to recommend the next strategic moves.
A report is the ultimate accountability tool. It shifts the conversation from "what did you do?" to "what did we achieve, and what's our next move?"
The Story That Justifies the Strategy
At the end of the day, the goal is to prove value and get everyone aligned on driving measurable growth. When a report tells this story well, it does more than just give an update.
It secures budgets, validates the strategy, and turns the agency-client dynamic from a simple transaction into a genuine growth partnership. This detailed, story-driven approach is a fundamental piece of any successful SaaS marketing strategy.
4 Types of Reports for Every Stakeholder
Just like a doctor wouldn't use a stethoscope to check for a broken bone, a great marketing agency doesn't use a single, one-size-fits-all report for every situation. You need different tools for different jobs. This is especially true for SaaS clients, who live and breathe data and are relentlessly focused on growth and a solid return on their investment.
Getting this right has never been more important. According to a 2023 report, the global digital advertising and marketing market is projected to grow from $786.2 billion in 2023 to $1.9 trillion by 2032. As brands continue to invest heavily in digital, their demand for clear, measurable results is only getting stronger. Proving your value through sharp, insightful reporting is no longer a nice-to-have—it's how you survive and thrive.
Let's break down the four essential reports you should have in your toolkit.
1. The Campaign Performance Report
Think of a Campaign Performance Report as a post-game analysis for a specific marketing play, like a new feature launch or a targeted lead-gen push. The whole point is to get granular and figure out exactly what happened during that one, focused initiative.
This report is for the people in the trenches—the marketing managers and specialists on both your team and the client's. It answers the critical questions: Which ads really worked? Which channels drove the best leads? What did we learn? It's the playbook you use to make tactical tweaks and ensure the next campaign is even better than the last.
2. The Monthly or Quarterly Performance Report
If the campaign report is a deep dive, the Monthly (or Quarterly) Performance Report is the regular, dependable health check. This is the bread and butter of agency reporting, giving a consistent overview of all marketing activities over a specific period.
It’s built for your main point of contact and their department head—the people who need to see steady progress against the big-picture goals. This report answers the simple but vital question: "Are we heading in the right direction?" It's all about building a narrative of momentum, showing trends over time, and making sure daily efforts are still tied to the client's ultimate business objectives.
A great monthly report doesn't just list metrics. It connects the dots between activities and outcomes, showing how last month's efforts are fueling this month's growth.
3. The High-Level Executive Summary
This one is for the corner office. The CEO, CFO, or other C-suite executives don't have the time or interest to pore over click-through rates and channel-specific metrics. They need the bottom line, and they need it now. This report is a super-condensed summary that directly links your marketing performance to what they care about most: revenue, customer acquisition cost (CAC), and overall business growth.
It’s short by design—often just a page or two—and packed with simple visuals that tell a powerful story about ROI. The goal here is to give leadership the confidence that their marketing investment is paying off, which helps justify budgets and get their buy-in for your next big idea. It’s all about the "so what?" behind all your hard work.
4. The Real-Time Dashboard
Finally, we have the Real-Time Dashboard. Think of this as the mission control center. Unlike the other reports, which are static snapshots in time, a dashboard is a live, dynamic view of what’s happening right now.
This is a game-changer for teams that need to be nimble and make quick decisions backed by data. Imagine your SaaS client is running a flash sale. With a dashboard, they can watch sign-ups roll in and adjust ad spend on the fly to maximize results. It’s all about immediacy, empowering both your teams to react instantly to whatever the market throws at them.
Choosing the Right Report for Your Audience
Not sure which report to use and when? It all comes down to who you're talking to and what you need to achieve. The right format ensures your message lands with clarity and impact, preventing your hard-earned data from getting lost in translation.
This table breaks down the four main report types to help you match the format to the audience.
| Report Type | Primary Goal | Key Audience | Typical Frequency |
|---|---|---|---|
| Campaign Report | Analyze a specific initiative's success and failures | Marketing Managers, Specialists | At the end of a campaign |
| Monthly/Quarterly Report | Track progress against goals and show momentum | Primary Client Contact, Department Heads | Monthly or Quarterly |
| Executive Summary | Demonstrate ROI and business impact | C-Suite Executives (CEO, CFO) | Monthly or Quarterly |
| Real-Time Dashboard | Enable quick, data-driven decision-making | Marketing Teams (Agency & Client) | Always on, real-time |
By picking the right report, you're not just sending data; you're delivering strategic value. You’re speaking your client’s language and giving each stakeholder the exact information they need to feel confident and informed.
4 Essential KPIs Your SaaS Client Actually Cares About
Let's be honest. Your SaaS clients don't care about a parade of acronyms in a report. They're laser-focused on one thing: growth. Every marketing dollar has a job, and your reports need to show, in plain English, that it's getting done. This means cutting through the fluff and zeroing in on the key performance indicators (KPIs) that directly tie your marketing activities to their bottom line.
A great way to structure this is to tell a story. Think of it like walking a customer through their journey with the brand. You start by getting their attention, then you build genuine interest, and finally, you guide them to a purchase and keep them happy. Each stage of this journey has its own set of critical metrics.
This approach creates a clear narrative that shows precisely how your efforts at each stage contribute to the end goal. Different reports will zoom in on different parts of this story, whether it's a granular campaign report or a high-level executive summary.
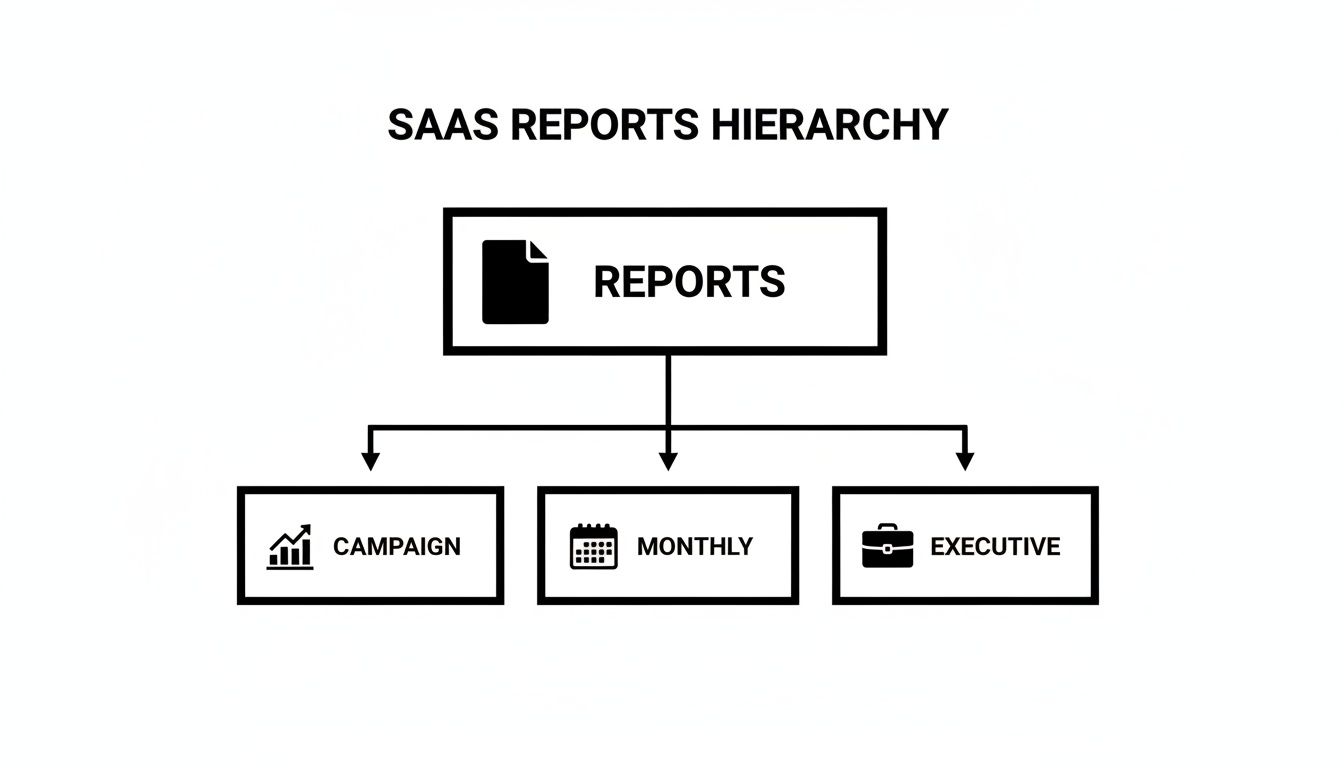
As you can see, each report has its place. They all work together to provide a complete picture, just for different people at different times.
Top-of-Funnel: Are We on Their Radar?
This is the awareness stage. Your goal is simple: get noticed by the right people. You're building brand presence and drawing your ideal customers into your client's world. The metrics here answer one fundamental question: "Is our target audience finding us?"
- Organic Traffic Growth: This tracks how many new visitors land on the site from search engines. A steady climb here is solid proof that your SEO and content strategy is resonating with what people are actively looking for.
- Share of Voice (SoV): Think of this as market share, but for conversations. It measures your client's brand visibility against their direct competitors. Essentially, it answers, "Of all the talk happening in our niche, how much of it is about us?"
- Backlink Profile Growth: For a SaaS company, high-quality backlinks are like votes of confidence from other authoritative sites. Tracking the number of new, relevant domains linking back shows that your content isn't just good—it's being recognized as a valuable resource.
Middle-of-Funnel: Are We Turning Interest into Intent?
Once you’ve got their attention, it’s time to nurture that initial spark of interest into active consideration. This is where potential customers start seriously evaluating your client's software. Your reports need to answer, "Are we successfully engaging prospects and moving them closer to a decision?"
A winning mid-funnel strategy doesn't just create a list of leads; it creates a pipeline of the right leads. Quality will always beat quantity when it comes to driving an efficient sales cycle.
Here are the key metrics to watch:
- Marketing Qualified Lead (MQL) Velocity: It's not just about the total number of MQLs you generate. What's more telling is the rate at which you're generating them month-over-month. An increasing velocity is a sign of a healthy, scalable lead-gen machine.
- Demo Request Rate: For most SaaS businesses, a demo request is a massive buying signal. This KPI tracks the percentage of website visitors who take that critical step. It’s a direct measure of how well your messaging is hitting home.
- Content Engagement: This goes way beyond surface-level page views. Look deeper. Are people downloading your whitepapers? Are they showing up for webinars? Are they spending significant time on your key blog posts? This tells you if your content is truly connecting.
Bottom-of-Funnel: Are We Closing Deals and Keeping Customers?
This is where your marketing efforts officially turn into revenue. The metrics at the bottom of the funnel are the ones the C-suite lives and dies by. They answer the ultimate question: "Are we efficiently acquiring and retaining profitable customers?"
There are three non-negotiable metrics for any SaaS report:
- Customer Acquisition Cost (CAC): Simply put, this is the total marketing and sales cost required to land one new customer. The constant goal is to drive this number down without ever sacrificing the quality of the customers you attract.
- Lifetime Value (LTV): This metric forecasts the total revenue a business can expect from a single customer over the entire course of their relationship. A high LTV means you’re bringing in the right kind of customers who stick around. The gold standard for a healthy SaaS business is an LTV to CAC ratio of 3:1 or better.
- Churn Rate: In the subscription-based world of SaaS, churn—the percentage of customers who cancel—is the silent killer. Keeping your churn rate as low as possible is every bit as crucial as acquiring new customers. High churn is like trying to fill a leaky bucket.
When you frame your marketing agency reports around these funnel-based metrics, you stop talking about vanity numbers. You start telling a compelling story about how your work is building a sustainable, profitable growth engine for your SaaS clients.
How to Structure a Report for Maximum Impact
A great marketing report does more than just dump data on a page; it tells a compelling story. It should walk your client through a journey, starting with a high-level overview of what happened and ending with a crystal-clear plan for what to do next.
When you have a proven blueprint for this story, your report transforms from a simple update into a strategic document that clients actually look forward to reading.
Think of it as a narrative with five distinct parts. This structure keeps your message clear, makes your case persuasive, and drives the conversation forward, cementing your role as a true growth partner.
Act 1: The Executive Summary
This is your "bottom line up front." Honestly, it’s the most critical part of the entire report because it’s often the only section a busy executive will read. You have to make it count with a concise, powerful snapshot of the whole story.
Your summary must immediately answer three questions: What were our goals? Did we hit them? What are the most important things to know? Nailing this is non-negotiable, so learning how to write an executive summary that gets read is a skill worth mastering.
Act 2: Performance Against Goals
Next up, you show the scoreboard. This section is a direct, no-fluff comparison of performance against the KPIs and goals you both agreed on at the start. It's all about providing clear, visual proof of progress.
Use simple charts and scorecards to show where you crushed it and where there’s room for improvement. For instance, a simple line graph showing "MQLs Generated" versus the "Monthly MQL Goal" speaks volumes. This part of the report is all about accountability and transparency.
Act 3: Channel-Specific Deep Dives
Now it’s time to show your work. This is where you provide the evidence that backs up your summary, breaking down performance by each marketing channel you manage—like SEO, paid ads, or content.
Give each channel its own mini-story, highlighting key metrics and any standout wins or hurdles.
- SEO: You could showcase the growth in organic traffic, improvements in keyword rankings for high-value terms, and the number of new backlinks you’ve earned.
- Paid Media: Go into the details on ROAS (Return on Ad Spend) for your main campaigns, the CTR (Click-Through Rate) on your top-performing ads, and the total conversions driven.
- Content Marketing: Call out the most successful blog posts or whitepapers, their engagement rates, and how many leads they generated from downloads.
This detailed breakdown shows you have a firm grasp on every part of the strategy and builds your client's confidence in your execution. For a deeper look at how structured reporting fits into a larger strategic picture, check out our guide on The Content Marketing Operations Maturity Model.
Act 4: Key Insights and Analysis
This is the all-important "so what?" section. Data is just noise until you give it meaning. Here, you connect the dots between channels and explain the why behind the numbers.
Your analysis is where you truly prove your value. It’s the difference between being a data reporter and a strategic partner. This section should explain what you’ve learned and why it matters to the client's business.
For example, did a spike in organic traffic from a particular blog post lead to a higher demo request rate? Did a specific ad campaign uncover a new, high-converting audience segment? This is where you share the strategic intelligence you've uncovered.
Act 5: Strategic Recommendations
Finally, you answer the big question: "What's next?" This is the forward-looking part of your marketing agency report that turns all those insights into a concrete action plan for the next month or quarter.
These recommendations show that you’re proactive and always thinking about your client's growth. According to a 2023 Gartner survey, 75% of marketing leaders are facing increased pressure to "do more with less." Agencies that provide clear, forward-looking recommendations don't just add value; they become indispensable partners in efficiency and growth.
Data Visualization That Tells a Clear Story

Let's be honest: nobody loves staring at a wall of numbers. Raw data on its own is just noise. Your job is to turn that noise into a clear, compelling story your client can actually use. That’s where smart data visualization comes in—it transforms your marketing agency reports from intimidating spreadsheets into an easy-to-read narrative.
How you show your data is just as important as the data itself. A confusing chart doesn't just look bad; it actively hides the very insights you worked so hard to uncover. The goal here is instant clarity, not cramming every possible metric onto one screen.
A powerful visual makes the main point jump off the page. The wrong one? It just creates confusion and makes your client's eyes glaze over.
Choosing the Right Chart for the Job
Your client shouldn't need a data science degree to figure out what they’re looking at. The trick is to match the chart type to the specific point you're making. A cluttered, poorly chosen graph is worse than no graph at all because it leads to frustration and buries your key takeaways.
Here’s a quick-and-dirty guide to picking the right visual for your data story:
- Bar Graphs for Comparisons: Need to show which channel drove more leads or which ad creative performed best? Bar graphs are your best friend for any kind of side-by-side comparison. They make winners and losers instantly obvious.
- Line Charts for Trends: When you want to show progress over time, nothing beats a line chart. It’s perfect for illustrating month-over-month traffic growth or tracking how MQLs trended across the quarter.
- Pie Charts for Composition: Use these sparingly, but they’re great for showing parts of a whole. A pie chart can give a quick, at-a-glance view of the traffic source breakdown (e.g., Organic vs. Paid vs. Social).
- Scorecards for Critical KPIs: Sometimes, one big number is the hero of the story. Don't bury it. Put it front and center in a big, bold scorecard. Total new customers or total revenue for the month? That deserves the spotlight.
Good data visualization isn’t just about making things look nice. It’s about creating a shortcut to understanding. The quicker your client "gets it," the more valuable your report—and your agency—becomes.
Transforming Delivery into a Dialogue
Even the world's most insightful report will collect digital dust if you just email it into the void. The final step, and arguably the most important, is turning the delivery of that report into a real conversation. This is what separates a vendor from a true strategic partner.
Always, always schedule a meeting to walk your client through the report. This simple act transforms a static document into a live strategy session. It’s your chance to add crucial context, answer questions on the spot, and steer the conversation toward what to do next. That personal touch builds more trust than a thousand emails ever could.
A live walk-through also lets you read the room, address concerns before they fester, and get everyone genuinely aligned on the plan forward. It’s this collaborative spirit that forges the kind of long-term client relationships we all want—ones built on trust and a shared mission for success.
Essential Tools to Automate and Streamline Reporting
Let’s be honest. Manually pulling data from a dozen different platforms isn't just a headache—it’s a massive time sink that stops your team from doing what you hired them for: thinking strategically. Smart automation can completely change the game, turning reporting from a tedious chore into a powerful advantage. This frees up your team to focus on what really matters: analysis and client growth.
The right tech stack doesn't just make creating marketing agency reports faster; it makes them more accurate, timely, and insightful. With global marketing spending on the rise, the pressure on agencies to prove ROI has never been higher. According to 2023 PwC research, 40% of CEOs believe their company won't be economically viable in a decade if it continues on its current path, putting immense pressure on every department—including marketing—to demonstrate clear value. You can find more insights on global business trends on pwc.com.
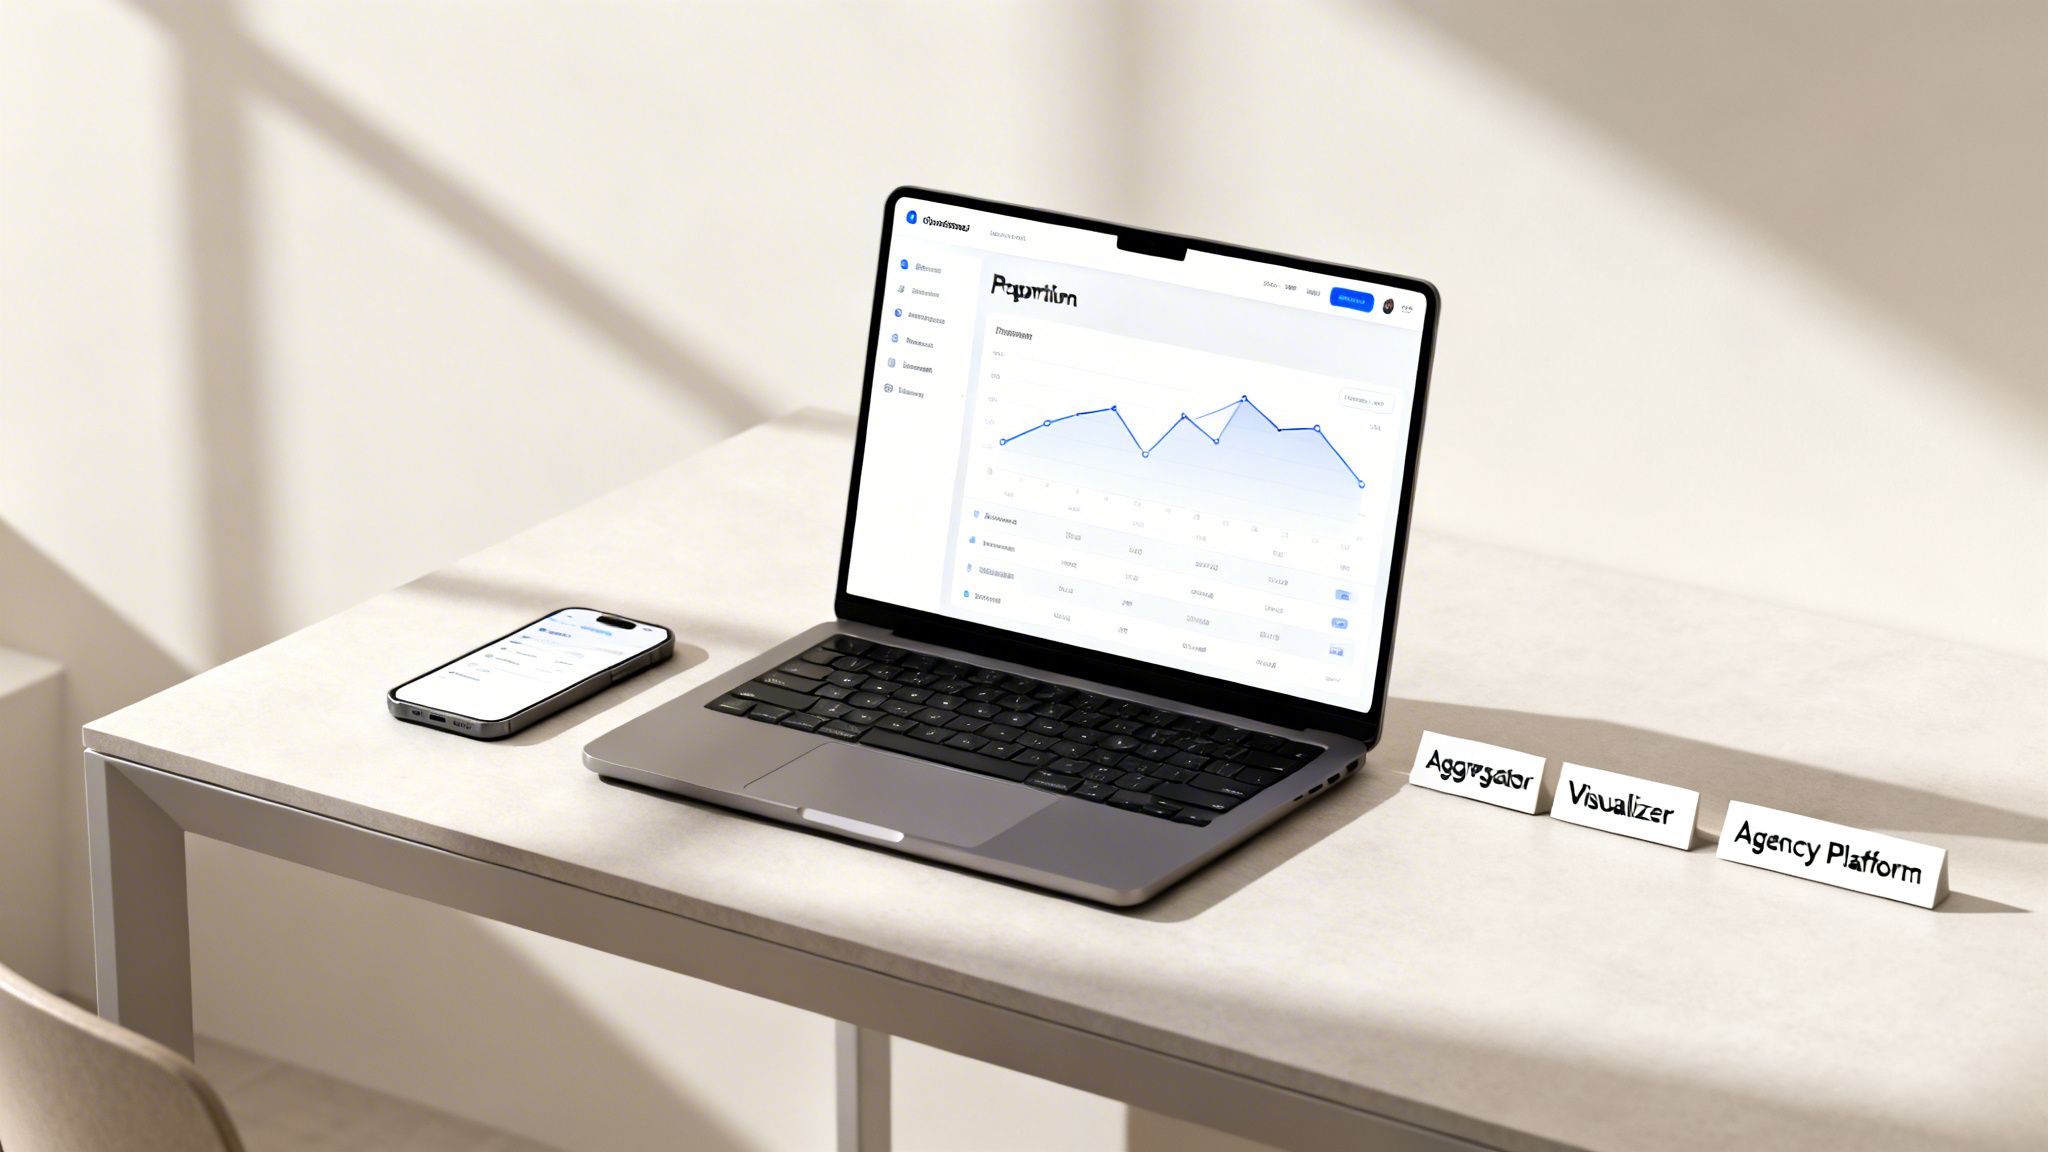
Data Aggregators: The Connectors
Think of data aggregators as universal adapters for all your marketing data. These tools solve the all-too-common problem of having critical metrics scattered across countless platforms—Google Analytics, Facebook Ads, your client’s CRM, you name it.
Platforms like Supermetrics or Funnel.io automatically pull all that disconnected data into one clean, unified location, like a Google Sheet or a data warehouse. This completely eliminates manual copy-pasting, drastically reduces the chance of human error, and ensures your reports are built on a solid foundation of consistent, reliable data.
Visualization Tools: The Storytellers
Once your data is neatly gathered in one place, visualization tools are what bring the story to life. A platform like Looker Studio (formerly Google Data Studio) or Tableau transforms raw numbers into the interactive dashboards and compelling charts we talked about earlier.
Their main job is to make complex information instantly understandable. Instead of just sending a spreadsheet, you can deliver a live dashboard. This lets clients explore the data themselves, drilling down into the metrics that are most important to them and creating a far more engaging and transparent reporting experience. If you’re looking to boost efficiency, consider tools that offer robust automation client reporting to make this process even smoother.
The right toolstack does more than save time. It elevates your agency’s professionalism and reinforces the idea that you are a data-driven partner focused on delivering clear, measurable outcomes.
All-in-One Agency Platforms: The Command Center
Finally, all-in-one platforms are designed specifically for the day-to-day realities of agency life. Tools like AgencyAnalytics or DashThis combine data aggregation, visualization, and client management features into a single, unified workflow.
These platforms essentially become the command center for all your client reporting. They often come with pre-built report templates, automated scheduling, and client-facing portals where stakeholders can log in anytime to see their latest results. They solve major agency headaches by standardizing the reporting process across all your accounts, ensuring a high-quality, professional look and feel every single time. As you build out your agency's capabilities, exploring different approaches to marketing operations can help you choose the right tools for your specific needs.
A Few Lingering Questions About Marketing Reports
Even with a solid plan, a few questions about marketing agency reports always seem to pop up. Nailing the answers to these common queries is a great way to build trust with your clients and show them you know your stuff. Let's tackle a few of the most frequent ones we hear.
How Often Should We Be Sending These things?
Finding the right rhythm for your reports is key. You want to provide consistent updates without overwhelming your client with meaningless noise. For most situations, a comprehensive monthly report is the sweet spot. It’s frequent enough to track progress and make smart adjustments but gives you enough time to see real trends emerge.
Of course, some projects move faster. If you're running a big product launch or a short, intense ad campaign, weekly check-ins or a live dashboard might be a better fit. We also like to use quarterly reports to zoom out for big-picture strategic reviews and annual reports to recap the year's wins and set the stage for next year's budget.
What’s the Real Difference Between a Report and a Dashboard?
It's a great question, and the answer is all about purpose. Think of it like this: a dashboard is the live scoreboard at a basketball game, while a report is the post-game analysis from the sports commentators.
A dashboard gives you a real-time, at-a-glance look at what’s happening right now. It's all about immediate feedback and monitoring live activity.
A report, on the other hand, is a snapshot in time. It takes the data from a specific period (like the last month) and adds context, analysis, and a story. It’s built to answer, "Here's what happened, here's why it happened, and here's what we think we should do next."
How Can I Make Our Reports Genuinely Useful for Clients?
This is the most important question of all. To make your reports truly valuable, you have to stop just dumping data on your clients and start delivering actual insights. They don't just want to see the numbers; they need to understand what those numbers mean for their business.
The best reports don't just look backward. They use the data from the past to chart a clear, strategic course for the future. That’s how you become a true partner, not just a vendor.
Always tie your marketing metrics back to what your client actually cares about—things like revenue, new sign-ups, or grabbing more market share. And here’s a pro tip: every single report you send should end with a section called "Recommendations & Next Steps." It's a simple change that shows you're thinking ahead and actively steering the ship.
Ready to turn your client reporting from a chore into a tool that wows your clients? At Mick-Mar Inc., we live and breathe data-driven marketing for SaaS and B2B tech companies. We create strategies that deliver results you can actually see. Let's build a reporting framework that proves your ROI and fuels your growth.