
At its heart, figuring out your customer churn rate is pretty simple. You take the number of customers you lost during a specific period (like a month or a quarter), divide it by the number you had at the very beginning of that period, and then multiply by 100 to get a percentage.
The formula looks like this: Churn Rate (%) = (Lost Customers ÷ Starting Customers) × 100.
Don't let that simplicity fool you, though. This single percentage is one of the most honest and powerful reflections of your business's health and how happy your customers truly are.
Why Churn Rate Is Your Most Honest Business Metric

It’s incredibly easy to get caught up in flashy metrics like new sign-ups or website traffic, but customer churn cuts right through the noise. Think of it as the unfiltered truth serum for your business, telling you exactly how much value customers really feel they’re getting from you.
Think of it as the pulse of your customer relationships. A low, steady pulse? That suggests a healthy, satisfied user base. But if it's high or erratic, it’s a clear signal that something needs your immediate attention.
A rising churn rate is a direct warning that something’s off. It could be a clunky onboarding process, a price point that doesn’t match the perceived value, or even a competitor who’s simply doing a better job of solving your customers' problems.
The Real-World Impact of Churn
Ignoring churn is like having a slow leak in a tire—it can quietly cripple your business from the inside out. For the B2B SaaS companies we work with at Mick-Mar Inc., even a seemingly small monthly churn has a massive compounding effect over time.
Let's walk through a quick example. Imagine you start January with 2,400 active customers, but 96 cancel by the end of the month. That’s a 4% monthly churn rate. It might not sound catastrophic, but at that pace, you could lose nearly half your entire customer base in just one year if nothing changes. This isn't just theory; a 2023 study by Recurly Research highlights that the average B2B monthly churn rate is around 4.79%, showing just how common—and dangerous—this scenario can be.
This isn't just a SaaS thing; it's a standard business vital sign. Stripe gives a great example: if a business starts a quarter with 200 customers and loses 10, its churn rate is 5% for that quarter. This kind of simple, consistent calculation is essential for tracking your performance and seeing how you stack up against others.
Churn rate isn't just a number to stick in a report—it's a diagnostic tool. It tells you exactly where your customer experience is breaking down and gives you the perfect starting point for fixing it.
More Than Just a Number
Ultimately, understanding how to calculate churn is the first step toward building a more resilient, customer-obsessed company. It gives you the clarity to make smarter decisions about everything from product development to your overall marketing strategy.
When you know why customers are leaving, you can start building a business they’ll never want to leave.
Before we dive deeper, here's a quick cheat sheet for the key churn formulas we'll be breaking down. This table is a handy reference you can come back to anytime you need a refresher.
Your Quick Reference for Churn Rate Formulas
| Churn Type | Formula | What It Tells You |
|---|---|---|
| Customer Churn Rate | (Lost Customers / Total Customers at Start) x 100 | The percentage of customers you lost in a period. |
| Revenue Churn Rate | (MRR Churned / MRR at Start) x 100 | The percentage of monthly recurring revenue lost. |
| Gross MRR Churn | (Downgrades + Cancellations) / MRR at Start | Revenue lost from existing customers, ignoring expansion. |
| Net MRR Churn | (Churned MRR – Expansion MRR) / MRR at Start | The net revenue change after accounting for upgrades. |
Each of these formulas tells a slightly different part of the story, giving you a more complete picture of your business's health. Now, let's get into the specifics of how to calculate each one.
Calculating Your Baseline Customer Churn
Diving into churn calculation can feel a bit overwhelming at first, but the core concept is pretty straightforward. The first metric you absolutely need to nail is customer churn, which you'll often hear called "logo churn." This tells you the percentage of individual customers who walked away during a specific period. It's the bedrock for understanding customer attrition.
But before you even think about plugging numbers into a formula, there are two foundational decisions you have to make. Getting these right ensures your churn rate is consistent, accurate, and actually means something for your business's health.
What Does "Churned" Actually Mean to You?
First things first: you need a crystal-clear definition of a "churned customer." This sounds obvious, but I've seen teams get tripped up by ambiguity here all the time. A churned customer is usually someone who actively cancels their subscription or simply doesn't renew when their contract is up.
But what about the gray areas?
- Failed Payments: Is a customer churned after one failed payment? Or do you give them a grace period, say, after three attempts over 30 days?
- Downgrades: If someone on a paid plan moves to your free tier, are they churned? From a revenue perspective, absolutely. For logo churn, they're still a user, but they no longer contribute to your bottom line.
- Ghosts in the Machine: What about a customer who is still paying but hasn't logged in for 90 days? They're not officially churned, but they're a massive churn risk.
You have to define these edge cases to maintain consistency. For our B2B SaaS example, let's define a churned customer as any paying account that formally cancels or has their subscription end without renewal within the period.
Choosing the Right Timeframe
Next up, you have to pick the period you're measuring. The most common cadences are monthly, quarterly, and annually. The right one for you really depends on your business model.
- Monthly is perfect for B2C subscriptions or any SaaS with month-to-month plans. It gives you a near real-time pulse on what’s happening.
- Quarterly or Annually makes more sense for B2B companies with longer contract cycles. A monthly churn rate won't tell you much if all your customers are locked into 12-month deals.
To keep things simple, we'll stick to a monthly churn calculation for our examples.
The Foundational Formula in Action
Alright, let's get our hands dirty. The standard formula for customer (logo) churn is as simple as it gets.
Churn Rate (%) = (Customers Who Churned in Period ÷ Customers at Start of Period) x 100
Let's run through a quick scenario for a fictional SaaS company, "ConnectSphere."
Scenario: ConnectSphere's May Churn
- They started May with 800 customers.
- 40 customers canceled their subscriptions during the month.
- They also brought in 75 new customers in May.
Notice that for this basic churn calculation, those 75 new customers don't factor in. We're only focused on the starting base and how many of those customers we lost.
Calculation:
(40 Churned Customers ÷ 800 Starting Customers) x 100 = 5% Monthly Customer Churn Rate
So, ConnectSphere lost 5% of its existing customer base in May. While you're tracking this, it's also a smart move to master your customer retention rate calculation, since retention is just the other side of the churn coin.
The chart below shows why even a seemingly small churn rate matters. Over time, it adds up.
As you can see, a consistent churn rate chips away at your customer base, showing a significant decline over several months.
Practical Tools for Your Calculation
You don't need a complicated analytics platform to get started. A simple spreadsheet or a bit of SQL can get the job done.
Excel / Google Sheets Formula
If you're tracking this in a spreadsheet, the formula is dead simple. Imagine your starting customer count is in cell B2 and your churned count is in B3:
=(B3/B2)
Just format that cell as a percentage, and you're good to go. It's an easy, low-tech way to monitor your churn month after month.
Basic SQL Query
If you have access to your company's database, you or your data team can pull these numbers with a quick query. This is a simplified example, but it captures the logic perfectly.
SELECT
(SELECT COUNT(DISTINCT customer_id) FROM subscriptions WHERE status = 'cancelled' AND cancellation_date BETWEEN '2024-05-01' AND '2024-05-31') * 100.0 /
(SELECT COUNT(DISTINCT customer_id) FROM subscriptions WHERE start_date < '2024-05-01' AND (status = 'active' OR cancellation_date >= '2024-05-01'));
This query counts the customers who canceled in May and divides that by the number of customers who were active at the start of the month.
Getting a Clearer Picture with Advanced Churn Formulas
A single, basic churn number is a decent starting point, but it can be really misleading, especially when your company is growing fast. Think of it like a car’s speedometer—it tells you how fast you're going right now, but it won’t tell you if you’re about to run out of gas or head straight for a cliff. This is where more advanced churn formulas come in. They give you a much richer, more accurate view of your business's health.
For companies expanding quickly, a big wave of new sign-ups can easily hide serious retention problems. Let's say you gain 100 new customers but lose 40 existing ones. Your net growth looks great on the surface, but a basic churn formula might not sound the alarm loud enough about those 40 customers who walked away. That's why we need to dig a little deeper.
This visual breaks down the core process into three simple steps.
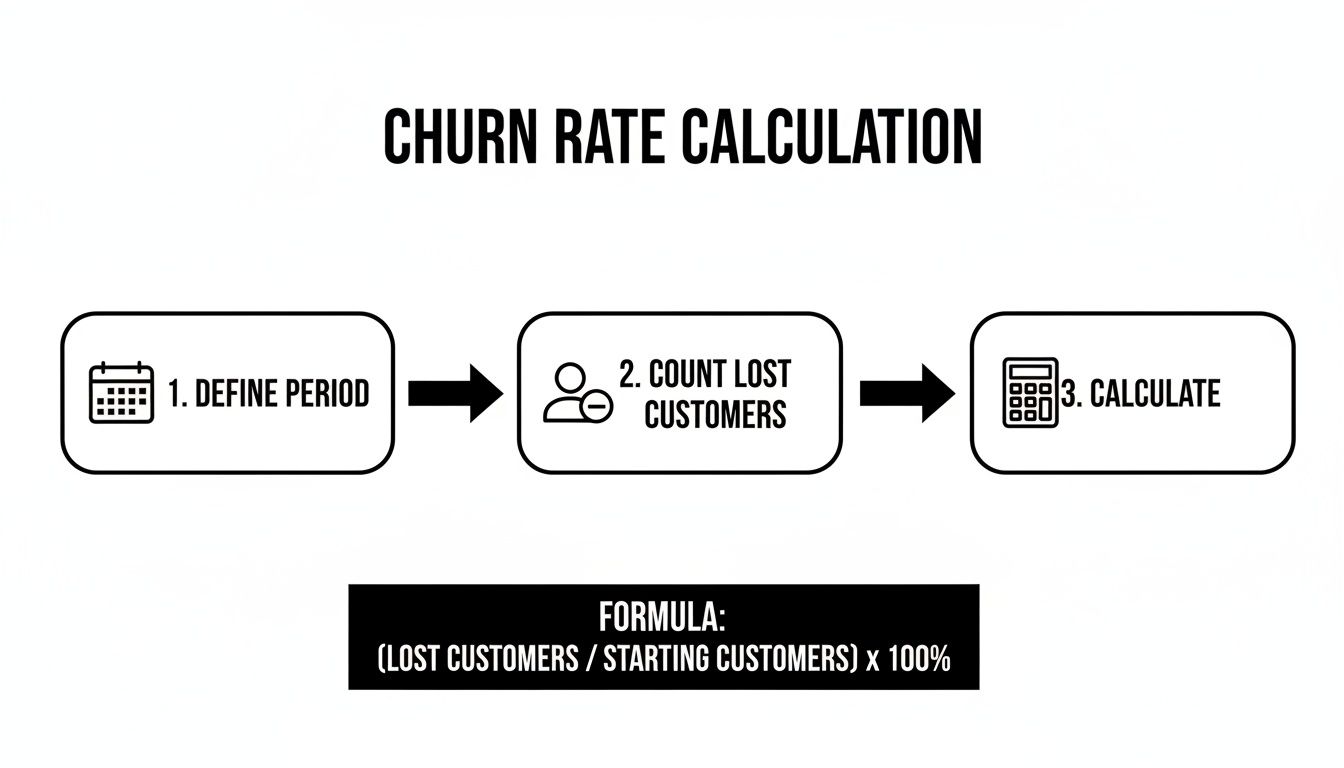
As the chart shows, it comes down to setting your time frame, counting the customers you lost, and then just plugging those numbers into the formula.
Why High-Growth Companies Need Adjusted Formulas
When your customer count is all over the place month-to-month, the standard churn formula can give you a skewed reading, either understating or overstating your real risk. For fast-growing SaaS companies, a smarter approach is to use an adjusted churn calculation. This method uses the average number of customers during a period, not just the number you started with.
The formula looks like this: Churn Rate (%) = Churned Customers ÷ [(Initial Customers + Final Customers) ÷ 2] × 100. It provides a more stable and representative metric during periods of big change.
Here’s a practical example. Say you start a month with 300 customers but lose 100 and end with 200.
- The basic formula gives you a 33.3% churn rate (100 ÷ 300).
- The average-customer method shows a 40% churn rate (100 ÷ [(300 + 200) ÷ 2]).
The 40% figure more accurately reflects the churn relative to the average customer base you were actually serving that month. This is the kind of detail agencies like Mick-Mar Inc. rely on when advising SaaS clients on their growth. It prevents them from misreading performance during a big marketing push that brings in a flood of new users.
Key Takeaway: Using an average-customer churn formula smooths out the noise from rapid growth or decline. It gives you a much truer picture of customer loyalty when your user base is in constant flux.
Going Deeper with Cohort Analysis
While an adjusted formula gives you a better number, it still doesn't answer the most important questions: Who is churning, and why are they leaving? This is where cohort analysis becomes your most powerful diagnostic tool. A cohort is just a group of customers who share a common trait, most often the month they signed up.
By tracking the "January sign-ups" versus the "February sign-ups" over time, you can pinpoint exactly when and where your customer experience might be failing.
Imagine you rolled out a major product update in March. A couple of months later, you notice your overall churn has ticked up. A single churn rate can’t tell you what happened.
But with cohort analysis, you might uncover something incredibly specific:
- January & February Cohorts: These groups are sticking around, with churn rates holding steady around 4% after three months.
- March Cohort: This group shows a massive churn spike of 15% in their third month.
- April Cohort: This group is also churning faster, hitting 12% in their second month.
Suddenly, you have a huge clue. The problem started with users who onboarded right after that March update. This allows you to investigate if the update introduced a nasty bug, made the interface confusing, or got rid of a feature new users really valued. You can find excellent resources on setting up these kinds of analyses in our guides to marketing operations.
Without cohort analysis, you'd be flying blind and just guessing at the cause. With it, you can form a clear hypothesis, talk to the right customers, and fix the root problem before it gets any worse. This transforms your churn rate from a simple vanity metric into an actionable roadmap for improvement.
Measuring the True Financial Impact of Churn
Knowing how many customers you've lost is one thing, but it doesn't tell you the whole story. Let's be real: losing ten startups on your basic plan is an entirely different problem than losing one enterprise client that makes up a huge slice of your revenue.
This is where we need to move beyond simply counting logos and start measuring the real financial damage. To get to the heart of your business's health, you have to track revenue churn.
This metric shifts the focus from the number of customers leaving to the value of the customers leaving. It’s the difference between knowing you have a leak and knowing exactly how much that leak is costing you, dollar for dollar.
Understanding Gross Revenue Churn
First up is Gross Revenue Churn. This calculation zooms in on the total monthly recurring revenue (MRR) you lost from existing customers due to cancellations and downgrades. It intentionally ignores any new revenue from upgrades or expansions, which gives you an unfiltered, often painful, look at how much value is eroding from your customer base.
The formula is clean and direct:
Gross Revenue Churn Rate (%) = (Churned MRR / MRR at Start of Period) x 100
"Churned MRR" here is the key. It includes revenue lost from customers who leave entirely and those who just downgrade to a cheaper plan. For instance, if a customer moves from a $500/month plan to a $200/month plan, that’s a $300 loss you absolutely must include in your churned MRR.
This metric is so powerful because it provides a stark, honest view of revenue leakage. It prevents the good news from upgrades from masking underlying problems with customer satisfaction or product-market fit.
A Practical Example of Gross Churn
Let's imagine a B2B SaaS company, "InnovateIQ," at the beginning of June.
- Starting MRR on June 1st: $200,000
- MRR Lost from Cancellations: $10,000
- MRR Lost from Downgrades: $3,000
Their total churned MRR for June comes out to $13,000 ($10,000 + $3,000).
Now, we can plug this into the formula to find their Gross Revenue Churn:
($13,000 Churned MRR ÷ $200,000 Starting MRR) x 100 = 6.5% Gross Revenue Churn
This tells InnovateIQ's leadership they lost 6.5% of their starting revenue base from existing customers in a single month. That’s a clear, actionable number they can take to their product and success teams to dig into what's going wrong. Getting this right is fundamental to accurately assessing your What Is Customer Lifetime Value and How to Grow It, a critical metric that directly reflects the long-term health of your customer relationships.
Introducing Net Revenue Churn
While gross churn shows you the damage, Net Revenue Churn gives you the bigger picture. It starts to factor in the positive momentum you're getting from your happiest customers. This metric subtracts expansion MRR—the revenue gained from existing customers upgrading or adding new services—from your churned MRR.
Here's the formula for net churn:
Net Revenue Churn Rate (%) = [(Churned MRR – Expansion MRR) / MRR at Start of Period] x 100
Net revenue churn answers a crucial question: is the revenue growth from your existing customers outpacing the revenue you're losing from churn? This is a metric that investors and executives absolutely love because it showcases the true growth engine within your current customer base.
The Power of Negative Net Churn
Let's head back to our InnovateIQ example. We know they lost $13,000 in MRR from churn. But during that same month, they also had some big wins with their existing clients.
- Expansion MRR in June: $18,000 (from upgrades and cross-sells)
Now, let's calculate their Net Revenue Churn:
[($13,000 Churned MRR – $18,000 Expansion MRR) ÷ $200,000 Starting MRR] x 100 = -2.5% Net Revenue Churn
This is the holy grail for subscription businesses: negative net churn. It means that even though InnovateIQ lost customers, the revenue growth from their remaining customers was strong enough to more than make up for the losses. It’s a powerful signal that you have a sticky product with happy customers who are willing to invest more with you over time.
This isn't just theory. Many of the top global SaaS companies focus heavily on revenue churn to grasp the financial impact of cancellations. As the team at Salesforce explains, you measure revenue churn by taking the MRR lost in a period and dividing it by the total MRR at the start of that period. This approach isolates the true revenue you lost without letting it get skewed by new sales or upsells.
For example, if you start with $500,000 in MRR and lose $35,000 from churn but gain $20,000 from expansion, your gross revenue churn is a straightforward 7%. This focus is vital because a few high-value contracts can represent a massive portion of your total MRR.
Turning Your Churn Data into Actionable Strategy

So, you've crunched the numbers and calculated your customer and revenue churn rates. Great. But that's just the beginning. A churn rate is just a number on a dashboard until you use it to tell a story and drive real change in your business.
The real magic happens when you move from what is happening to why it's happening. The first question I always get is, "What's a good churn rate?" The honest answer? It depends.
What Is a Good Churn Rate
There's no single magic number for churn. Benchmarks are all over the place because every industry, business model, and customer segment is different.
That said, for SaaS companies, a decent annual logo churn rate often falls in the 5% to 7% range. But you have to peel back the layers. Who you sell to makes a massive difference.
- Selling to Enterprises? If you’re dealing with large enterprise clients, your churn should be much lower, ideally around 1-2% monthly. Think about it: they have long contracts, high switching costs, and your product is probably deeply embedded in their workflow.
- Selling to SMBs? On the other hand, if your customers are small to medium-sized businesses, expect higher churn. Monthly rates of 3-7% are pretty common. SMBs are just naturally more volatile and more sensitive to price.
And don't let a low monthly number fool you. A 5% monthly churn sounds manageable, but it compounds to losing nearly half your customers in a year. That’s why you have to track it relentlessly.
The goal isn't just to hit an arbitrary benchmark. It's to understand your own baseline and then relentlessly work to improve it. Your best benchmark is your own performance last quarter.
Diagnosing the Root Causes of Churn
Once you have your numbers in context, it's time to put on your detective hat. Your churn metrics are just clues pointing to bigger problems.
Is your revenue churn way higher than your logo churn? That’s a five-alarm fire. It means you’re not just losing customers; you’re losing your best customers. You need to drop everything and figure out why your highest-paying clients are walking out the door.
Or maybe you see a sudden spike in churn from a specific cohort. What was going on when that group signed up? A botched product update? A confusing pricing change? A new competitor swooping in with a flashy offer?
To find the real answers, you have to look beyond the spreadsheet and actually listen.
Your Churn Diagnosis Framework
The "why" behind your churn won't be found in a formula. It comes from combining your quantitative data with qualitative feedback. In other words, you need to talk to people.
- Dig into Exit Surveys: When a customer cancels, ask them why. Keep it short and simple. Was it the price? A missing feature? Bad service? Over time, you'll start to see patterns.
- Scour Support Tickets: Your customer support team is sitting on a goldmine of information. Look at the tickets from customers who churned. Were they all complaining about the same bug? Did they feel ignored?
- Talk to Your Frontline Teams: Your sales and customer success teams have their ears to the ground. They often know a customer is at risk long before they show up on a churn report. Ask them what they're hearing in their daily conversations.
When you blend these insights with your data, the picture becomes incredibly clear. You might find that 70% of churned customers from your Q2 cohort all submitted tickets about the same clunky feature. Boom. Now you have a specific, actionable problem to solve.
This feedback loop is a critical piece of any solid content marketing and strategic communications plan because it forces your product and messaging to stay aligned with what customers actually need.
Turning Insights into Immediate Action
Once you have a diagnosis, you can prescribe a targeted cure. Don't try to fix everything at once. Focus on a few high-impact changes that will move the needle.
- For the Product Team: If a clunky UI is driving people away, make that a priority. Your churn data is the evidence you need to justify spending development time on improving the user experience instead of chasing the next shiny new feature.
- For the Marketing Team: Are customers churning because they never understood the product's full value? It's time to refresh your onboarding emails, create better tutorials, or publish case studies that show a clear path to ROI.
- For the Customer Success Team: If you can spot at-risk behavior—like a sudden drop in logins—get your success team on it. A quick, proactive check-in can be the difference between a saved account and a lost customer.
By systematically diagnosing the problem and giving teams clear marching orders, churn stops being a scary metric and becomes your best tool for growth.
Answering Your Top Churn Questions
Once you start getting into the weeds with churn calculations, a few questions always seem to surface. Nailing down the answers is the key to making sure your metrics are consistent, accurate, and actually useful for making smart business decisions.
Let's break down some of the most common points of confusion I see teams run into.
Should I Include New Customers in My Churn Calculation?
This is probably the most common question, and for a standard customer churn rate, the answer is a firm no. The classic formula is all about measuring the loyalty of the customer base you started the period with.
Tossing new customers into that calculation just muddies the waters. You end up mixing your acquisition efforts with your retention numbers, which makes it impossible to see a clear picture of either.
That said, for a startup in hyper-growth mode, only looking at the starting customer base can feel a bit skewed. That's exactly why other formulas, like the average-customer method we talked about, were developed. They help give you a more balanced view when your customer count is changing dramatically month over month.
What's the Difference Between Customer Churn and Revenue Churn?
This is a critical one. These two metrics can tell completely different stories about the health of your business, and you absolutely need to track both.
Here’s the simplest way to think about it:
- Customer Churn (or Logo Churn): This is just a headcount. It’s the percentage of customers or accounts you lost. If one massive enterprise client and ten tiny startups leave, your logo churn count is eleven.
- Revenue Churn: This measures the financial bleeding. It’s the percentage of recurring revenue you lost from those departing customers. That one enterprise client might have been worth more than the other ten combined, making your revenue churn devastatingly high even if your logo churn looks okay.
A low logo churn paired with a high revenue churn is a five-alarm fire. It’s a clear signal that your most valuable customers are walking out the door, and it helps you focus your retention efforts where the financial impact is greatest.
How Often Should I Calculate Churn?
There’s no magic number here—it really comes down to your business model and contract lengths.
- Monthly is the go-to for most B2C subscription businesses and SaaS companies with a lot of month-to-month plans. It gives you a constant, near real-time pulse on how things are going.
- Quarterly often makes more sense for B2B companies, especially those with longer sales cycles or customers locked into annual or quarterly contracts. A monthly number just wouldn't show much movement.
- Annually is essential for high-level strategic planning. While you'll track it more often, the annual figure is what you'll use to compare yourself against industry benchmarks and set long-term goals.
My Two Cents: Even if your official reporting is quarterly or annual, get in the habit of calculating churn monthly for your internal team. It lets you spot a negative trend early and jump on it before it spirals into a real problem.
What About Involuntary Churn?
Finally, you have to split your churn into two buckets: voluntary and involuntary.
Voluntary churn is what we usually think of—a customer makes a conscious choice to cancel. Involuntary churn, on the other hand, is completely accidental. It happens because a credit card expired, a payment failed, or billing info is out of date.
Why bother separating them? Because the solutions are worlds apart. You fight voluntary churn with a better product, stellar customer service, and a stronger value proposition. You fix involuntary churn—which can be a shocking 20-40% of your total churn—with tactical tools like automated payment reminders and dunning management systems.
By segmenting them, you can attack each root cause with the right strategy instead of trying a one-size-fits-all approach that's doomed to fail.
Understanding and acting on your churn data is the first step toward building a more resilient business. At Mick-Mar Inc., we specialize in creating marketing strategies that not only attract new customers but also build the loyalty that keeps them for the long haul. Discover how our approach can strengthen your customer relationships and drive sustainable growth at https://mick-mar.com/.