If you want to measure marketing’s impact, you have to start with the "why." What are the core business goals we're actually trying to hit? From there, and only from there, can you pick the right Key Performance Indicators (KPIs) to track your progress. It's all about drawing a straight line from every click, every piece of content, and every campaign directly to tangible business outcomes like revenue growth and lower acquisition costs.
Building Your Measurement Foundation
Jumping into measurement without a clear plan is a surefire way to get overwhelmed. You'll quickly find yourself drowning in a sea of vanity metrics—things like social media likes or total page views. They might look good on a report, but they don't tell you if marketing is actually moving the needle on revenue.
For any B2B SaaS company, a solid measurement foundation is non-negotiable. It’s what separates teams that just track data from those who interpret it to make smarter, faster decisions.
This means you need to move beyond generic numbers and define goals that matter to the business. Think in terms of increasing Monthly Recurring Revenue (MRR), driving down customer churn, or lowering the Customer Acquisition Cost (CAC). The whole point is to build a system that proves marketing’s value in a language the C-suite speaks fluently: financial impact.
Setting Clear Goals and Baselines
You can’t measure improvement if you don’t know where you’re starting from. The first real step is to establish a performance baseline. Pull your historical data from the last 6-12 months to get a clear picture of your current state.
What’s your average conversion rate from a demo request to a closed-won deal? What’s your CAC right now? These numbers become your benchmark, the starting line against which you’ll measure all future success.
With a baseline in hand, you can set meaningful SMART goals:
- Specific: What, exactly, are we trying to do? (e.g., "Increase marketing-qualified leads from our blog.")
- Measurable: How will we know we did it? (e.g., "Increase MQLs by 20%.")
- Achievable: Is this actually possible with our team and budget?
- Relevant: Does this support a bigger business objective? (e.g., "This MQL goal directly supports the company's overall revenue target.")
- Time-bound: What’s the deadline? (e.g., "By the end of Q3.")
Of course, a strong measurement foundation is built on accurate, trustworthy data. If your inputs are messy, your outputs will be useless. That’s why it’s so critical to understand how to improve data quality right from the start.
Aligning KPIs with the SaaS Funnel
Not all KPIs carry the same weight, and their importance changes depending on where a customer is in their journey. A top-of-funnel metric like website traffic is great for gauging awareness, but it's a terrible indicator of actual sales. To get the full story, you need to map the right KPIs to each stage of your funnel.
For example, at the top of the funnel (Awareness), you’ll want to focus on things like unique visitors, keyword rankings, and social reach. As people move into the middle (Consideration), your focus shifts to lead conversion rates, content downloads, and demo requests.
By the time they reach the bottom (Decision), the metrics that matter most are trial-to-paid conversion rates, CAC, and sales cycle length.
To make this easier, here’s a breakdown of the most critical KPIs to watch across the entire SaaS funnel.
Essential SaaS Marketing KPIs Across the Funnel
This table breaks down the most critical KPIs for each stage of the SaaS marketing and sales funnel, helping you select the right metrics to track.
| Funnel Stage | Key Performance Indicator (KPI) | What It Measures |
|---|---|---|
| Top of Funnel (Awareness) | Unique Website Visitors | The number of distinct individuals visiting your site. |
| Keyword Rankings | Your organic search position for target keywords. | |
| Social Media Engagement | Likes, shares, comments, and reach on social platforms. | |
| Middle of Funnel (Consideration) | Lead Conversion Rate | The percentage of visitors who become leads (e.g., fill out a form). |
| Marketing Qualified Leads (MQLs) | The number of leads deemed likely to become customers. | |
| Cost Per Lead (CPL) | The average cost to acquire one new lead. | |
| Bottom of Funnel (Decision) | Sales Qualified Leads (SQLs) | The number of MQLs accepted by the sales team for follow-up. |
| Trial-to-Paid Conversion Rate | The percentage of free trial users who become paying customers. | |
| Customer Acquisition Cost (CAC) | The total cost to acquire a new paying customer. |
Focusing on the right metrics at the right time gives you a much clearer signal about what’s working and what isn’t.
I see so many teams make the mistake of treating every metric as equally important. The real key is to pinpoint the one or two "North Star" metrics for each funnel stage that have the strongest correlation to revenue. For a lot of SaaS businesses, that’s going to be something like 'qualified demo requests' or 'free trial sign-ups'.
This structured approach ensures you’re not just passively collecting data, but actively monitoring the health of your entire acquisition engine. As your marketing operations grow, your measurement system will need to evolve, too. You can learn more about this journey in the content marketing operations maturity model, which shows how to progress from a reactive to a fully optimized state. This ensures your foundation is built not just for today, but for long-term growth.
Choosing the Right Marketing Attribution Model
Okay, you've got your goals and KPIs locked in. Now for the million-dollar question: how do you give credit where credit is due?
In the world of B2B SaaS, a customer's journey from stranger to signed contract can be a long and winding road. They might discover your blog through a Google search, see a retargeting ad on LinkedIn, attend your webinar a month later, and finally click a link in a newsletter to book a demo.
So, which one of those touchpoints actually sealed the deal?
This is the exact problem that marketing attribution is designed to solve. An attribution model is simply the rulebook you use to assign value to each stop on that buyer's journey. Nailing this is critical because it directly influences where you spend your budget and what you focus on next.
Think of it like a business intelligence process. You start with a clear objective, then figure out the KPIs, tools, and analysis needed to get there.
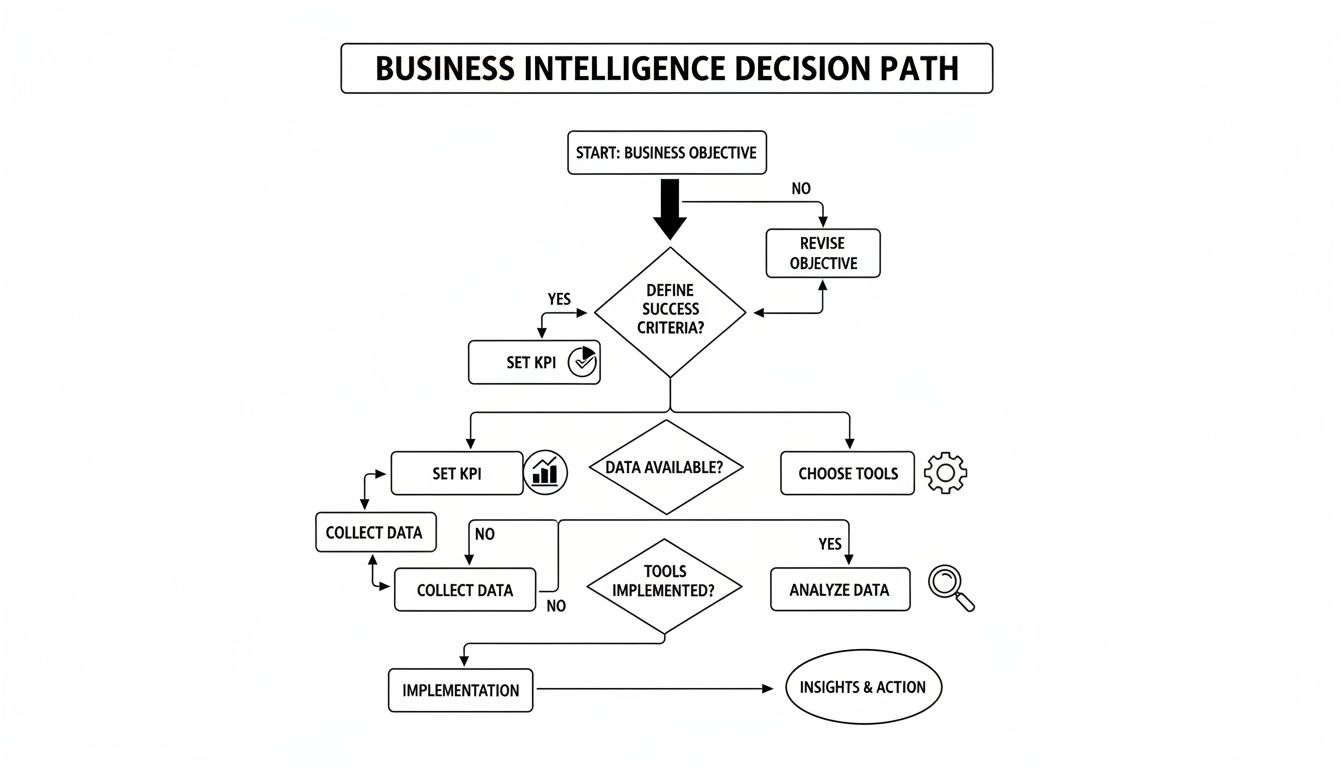
This flowchart really drives the point home: your attribution model isn't chosen in a vacuum. It’s a direct extension of the business goals you've already set.
Single-Touch vs. Multi-Touch Attribution
Generally, attribution models are sorted into two camps: single-touch and multi-touch. Single-touch models are the easiest to understand—they give 100% of the credit for a conversion to a single interaction.
- First-Touch Attribution: This model gives all the credit to the very first interaction a person had with your company. It's fantastic for figuring out which channels are actually generating new awareness and filling the top of your funnel. If demand generation is your main game, this model is a solid starting point.
- Last-Touch Attribution: The polar opposite. Here, all the credit goes to the final touchpoint right before conversion. This is great for identifying what convinces people to finally take action, making it a go-to for teams obsessed with bottom-of-funnel performance.
The problem? Single-touch models are too simple. They just don't reflect reality, where multiple touchpoints nudge a buyer toward a decision. That's where multi-touch attribution enters the picture, spreading the credit across several interactions.
For a SaaS company with a six-month sales cycle, relying solely on a last-touch model is like only crediting the final assist in a basketball game. It completely ignores the crucial plays that moved the ball down the court in the first place.
Popular Multi-Touch Attribution Models
Multi-touch models give you a much more nuanced and realistic view of what’s working. A few of the most common approaches have proven their worth time and again:
- Linear: This is the "everyone gets a trophy" model. It splits credit equally among all touchpoints. If a customer had five interactions, each one gets 20% of the credit. It’s fair, but it also assumes every touchpoint had the same impact, which is rarely true.
- Time-Decay: This model smartly gives more credit to the interactions that happened closer to the conversion. The webinar a prospect attended yesterday gets more weight than the blog post they read three months ago. This is perfect for shorter, more intense sales cycles where recent actions matter most.
- U-Shaped (Position-Based): I'm a big fan of this one. It gives 40% of the credit to the first touch, 40% to the last touch, and splits the remaining 20% among all the interactions in the middle. It beautifully highlights the channels that both introduce and close leads.
Your choice here really depends on your business goals and how complex your customer journey is. If you're looking to build a cohesive strategy, getting a handle on the fundamentals of digital marketing and advertising can give you the context you need to pick the right model.
Navigating a Privacy-First World
Let's be honest, the entire conversation around attribution is changing. With third-party cookies on their way out and a much-needed focus on user privacy, the old ways of tracking are becoming obsolete. It's getting a lot harder for marketers to connect all the dots across different platforms and sessions.
This shift means you can no longer rely only on granular, user-level tracking. It’s becoming essential to blend your attribution data with broader analyses, like Marketing Mix Modeling (MMM), which we'll dive into later. The key is to be adaptable. Focus on strengthening your first-party data (the information you collect directly from your audience) and use models that respect user privacy while still giving you the insights you need to grow.
Translating Data into Business Impact
Once you’ve wrestled with your attribution model, the real work begins. It’s time to translate all that raw data into the one language every C-suite executive understands: financial impact. This is how you shift the conversation from "marketing spent X" to "marketing drove Y in revenue." You're proving that marketing isn't just a line item on a budget sheet, but a predictable, powerful engine for growth.
This is where a few core SaaS metrics become your best friends: Customer Acquisition Cost (CAC), Lifetime Value (LTV), and Return on Marketing Investment (ROMI). Getting a handle on these numbers is non-negotiable if you want to prove your worth and make a solid case for next year's budget.

Calculating Customer Acquisition Cost
Your Customer Acquisition Cost, or CAC, is simply what it costs you, on average, to win a single new customer. It’s the ultimate report card for your go-to-market efficiency.
The formula itself is pretty straightforward:
CAC = (Total Sales & Marketing Spend) / (Number of New Customers Acquired)
Don't forget to include everything in your "Total Sales & Marketing Spend"—salaries for your team, ad spend, content creation costs, software subscriptions, the works.
Let's run a quick example. Say in Q3, your total sales and marketing spend came out to $150,000, and you brought in 50 brand new customers.
Your CAC would be: $150,000 / 50 = $3,000
So, you spent $3,000 to acquire each of those customers. That number on its own is just a data point, though. It only becomes truly meaningful when you compare it to how much value those customers bring in over time.
Understanding Customer Lifetime Value
That brings us to Customer Lifetime Value (LTV). This metric projects the total revenue you can reasonably expect to earn from a single customer over the entire duration of their relationship with you. A high LTV is the hallmark of a healthy SaaS business—it means your customers love your product, stick around, and continue to pay you.
A simple way to calculate it is:
LTV = (Average Revenue Per Account) / (Customer Churn Rate)
Let's imagine your Average Revenue Per Account (ARPA) is $1,000 per month, and your monthly Customer Churn Rate is a steady 2%.
Your LTV calculation looks like this: $1,000 / 0.02 = $50,000
This means that, on average, each customer is worth $50,000 to your business. In an era of constant change, focusing on LTV is more critical than ever. According to 2023 research, acquiring a new customer can cost five times more than retaining an existing one, making metrics that track loyalty and long-term value essential for sustainable SaaS growth.
The All-Important LTV to CAC Ratio
Now, let's put it all together. The LTV to CAC ratio is arguably the most vital health metric for any SaaS company. It directly answers the question: "For every dollar we spend acquiring a customer, how many dollars do we get back?"
A healthy LTV to CAC ratio is widely considered to be at least 3:1. Here's a quick breakdown:
- 1:1 Ratio: You're losing money. For every dollar you spend, you only make one back.
- 3:1 Ratio: This is the sweet spot. It signals a strong, sustainable business model.
- 5:1 Ratio or higher: You're running an incredibly efficient machine. In fact, you might be under-investing in growth and have room to spend more aggressively.
Using our numbers from before, the ratio would be $50,000 (LTV) to $3,000 (CAC). That simplifies down to a 16.7:1 ratio—an exceptionally strong signal that it’s time to pour more fuel on the fire.
Measuring Return on Marketing Investment
Finally, we get to Return on Marketing Investment (ROMI). While LTV:CAC gives you the long-term strategic view, ROMI is your tactical tool for measuring the direct profitability of a specific campaign or channel over a shorter timeframe.
Here's the formula:
ROMI = [(Revenue Attributable to Marketing – Marketing Spend) / Marketing Spend] x 100
Picture this: you run a LinkedIn ads campaign that costs $10,000. After tracking the results, you can attribute $45,000 in new revenue directly to that campaign.
Your ROMI calculation would be: [($45,000 - $10,000) / $10,000] x 100 = 350%
A 350% ROMI is a fantastic result. It's a hard number you can take to your leadership team that proves for every dollar you put into that campaign, the business got $3.50 back. At the end of the day, all this measurement is about making smarter choices. Understanding the core tenets of data-driven decision making is what turns these insights into real business growth.
A Holistic View with Marketing Mix Modeling
Attribution models are fantastic for dissecting the fine details of your digital touchpoints, but they have a massive blind spot: the bigger picture. They just can't account for the impact of things like industry events, brand campaigns, or good old-fashioned word-of-mouth. For any SaaS company trying to scale, that’s a problem.
This is exactly where Marketing Mix Modeling (MMM) comes in. It’s a completely different way of looking at performance—a top-down, statistical analysis that gives you a panoramic view. Instead of obsessing over individual user journeys, MMM crunches historical data in aggregate to show how different marketing inputs actually drive outcomes like revenue or sign-ups.
Think of it this way: attribution is like examining individual threads in a piece of fabric. MMM is like stepping back to see the entire tapestry. It helps you finally understand the incremental lift from all your marketing activities, both online and off, and see how they influence each other.
Why MMM is Making a Comeback
You’re probably hearing more about MMM lately, and for good reason. First off, with the death of third-party cookies, tracking every single user is getting harder and less reliable. MMM sidesteps this issue entirely by using aggregated, first-party data, making it a privacy-friendly way to measure what’s working.
MMM also shines where traditional attribution falls flat—measuring the long-term impact of brand building. What was the real value of that big sponsorship at a major tech conference? Or that PR push that landed you in a top publication? Attribution models have no clue, but MMM can actually quantify their influence on your bottom line over time.
This approach is becoming a serious competitive advantage. A 2023 study from BCG found that companies using modern MMM can unlock 10% to 20% in marketing efficiency. With the intense pressure on marketers to prove ROI, it’s no surprise that many are adopting these more advanced methods to navigate privacy changes and optimize their spend.
By looking at macro trends and correlations, Marketing Mix Modeling uncovers the "why" behind your performance. It can reveal that a spike in sign-ups wasn't just due to a paid search campaign, but was also influenced by a recent podcast feature that boosted brand recall.
How Marketing Mix Modeling Works
Under the hood, MMM uses regression analysis to figure out the relationship between what you spend on marketing and what you get back in sales. The model isn't just looking at ad spend, though; it intelligently separates out several key factors.
- Base Drivers: This is the baseline—the sales you’d get even if you stopped all marketing tomorrow. It’s driven by things like your brand equity and general market presence.
- Incremental Drivers: Here’s where your marketing comes in. The model quantifies the specific contribution of each channel, whether it's paid social, content, or email campaigns.
- External Factors: A smart MMM also accounts for things you can’t control, like seasonality, a competitor's big launch, or economic shifts. This helps isolate the true impact of your own efforts.
Putting MMM into Practice
Let’s be clear: implementing MMM isn't a simple plug-and-play solution. It’s a serious undertaking that requires a solid foundation, starting with clean, historical data—you'll want at least two to three years' worth to build a reliable model.
Here’s what you really need to get started:
- Comprehensive Data Collection: You need consistent, historical data on marketing spend and activity for every single channel, lined up against your sales and revenue data.
- Statistical Expertise: This isn't a job for a spreadsheet. You'll need data scientists or a specialized partner who can build, validate, and interpret the statistical models correctly.
- Cross-Functional Buy-In: MMM pulls data from everywhere, so you need marketing, sales, and finance to be on board and provide the right inputs to make the model reflect reality.
While it demands a bigger investment upfront, the strategic payoff is huge. Companies using MMM well can optimize their budgets with incredible precision, forecast performance more accurately, and finally get a real answer to the ROI of those hard-to-measure brand initiatives.
Building Your Marketing Measurement Tech Stack
It’s one thing to know which metrics matter, but it's a whole other ballgame to actually capture, analyze, and act on them. The best data in the world is useless if you don't have the right technology to make sense of it. This is where your marketing tech stack comes in—it's the engine room of your entire measurement strategy.
Think of your stack as the operational backbone that holds everything together. It's the collection of software that gathers customer data, tracks every little interaction, and serves up insights so you can make smarter, faster decisions. Without a properly integrated system, you're just staring at a bunch of data silos, each telling you a different, incomplete story.
The Core Components of a Modern Stack
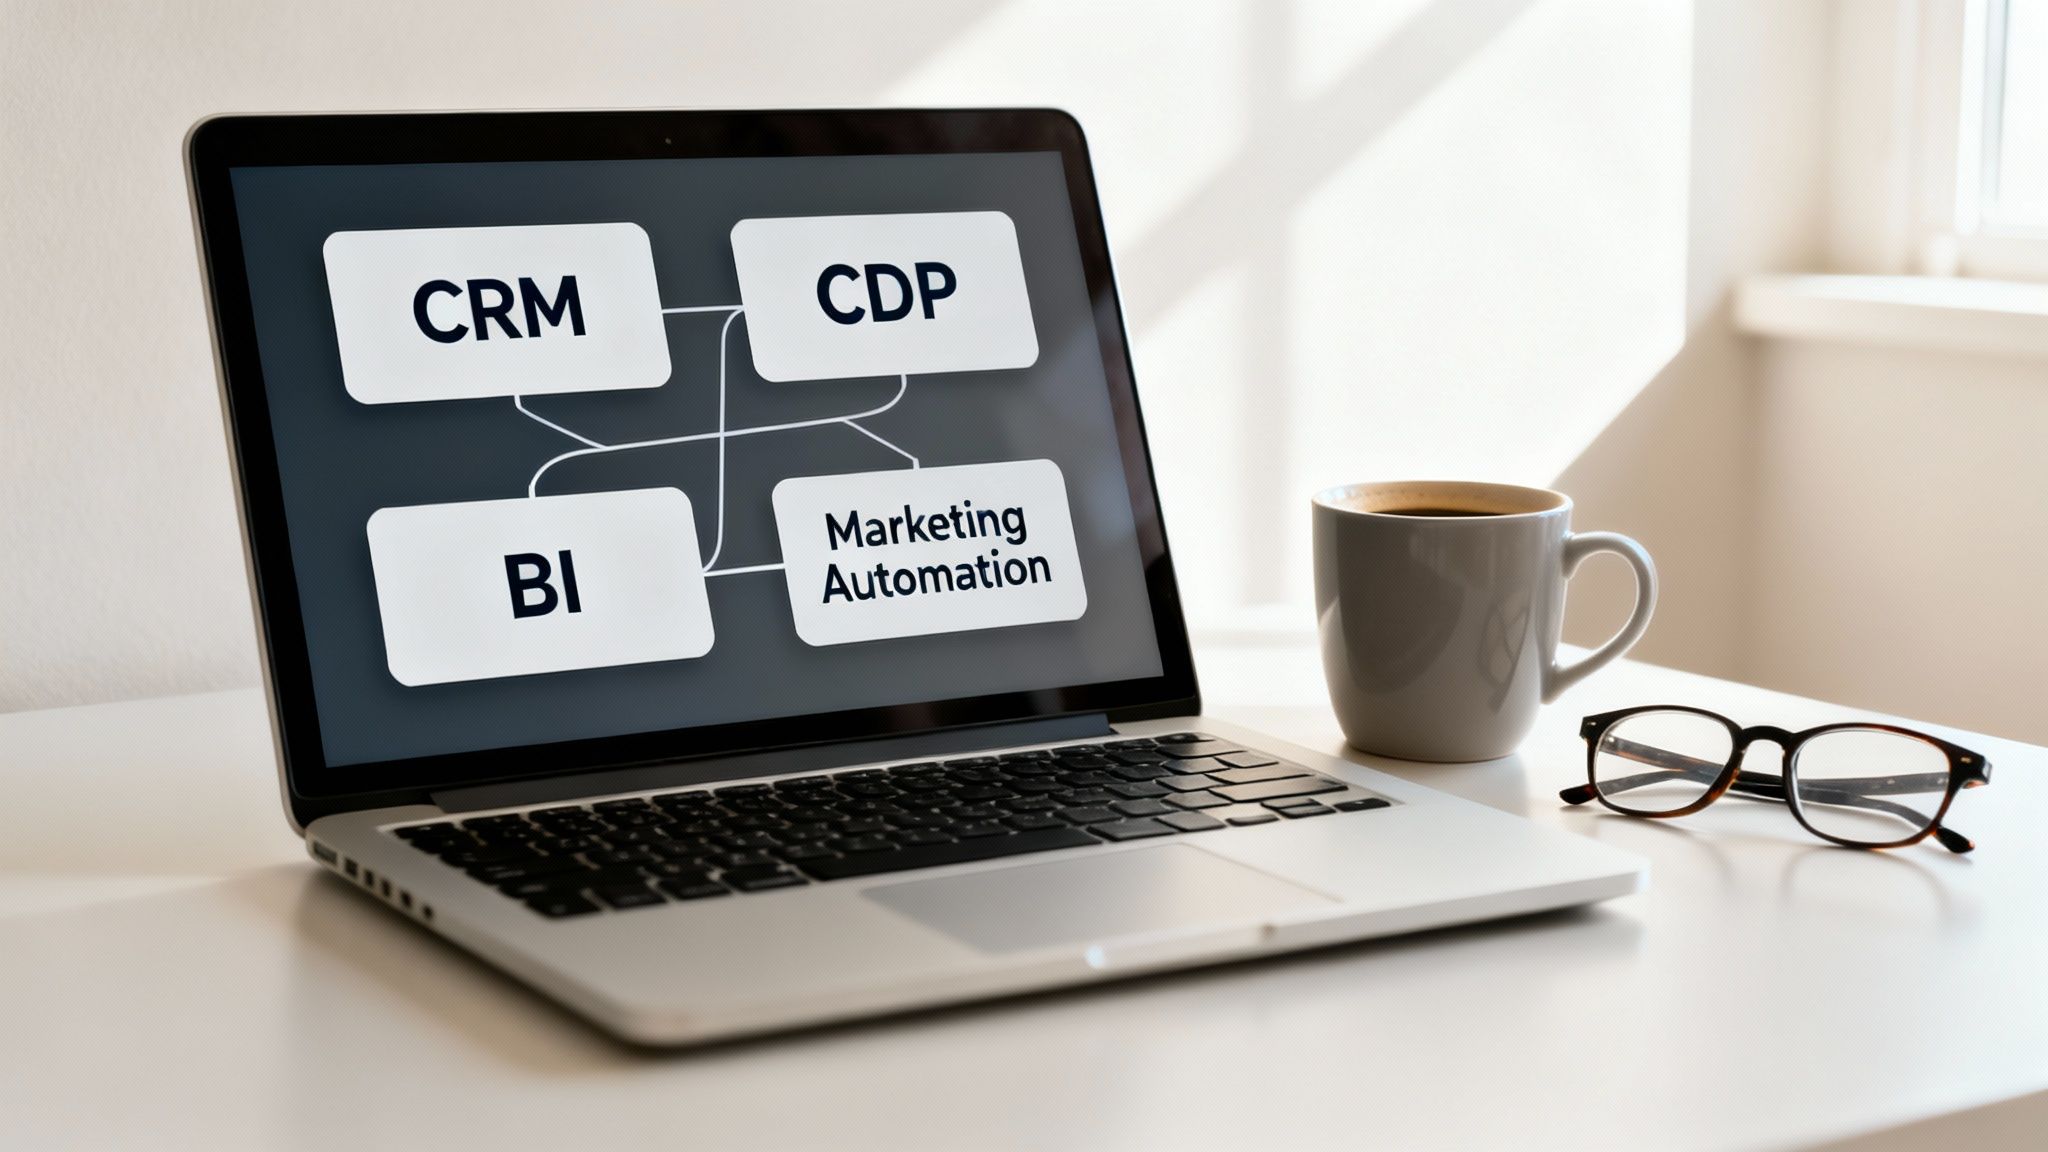
A powerful measurement stack doesn't need to be overwhelmingly complex. You just need to cover the essentials of the customer journey, from that first flicker of awareness all the way through to long-term loyalty. I like to think of it as having four fundamental pillars.
-
Customer Relationship Management (CRM): This is your single source of truth for all things customer-related. It's where you track lead statuses, deal stages, and, most importantly, revenue. A clean, well-maintained CRM like Salesforce or HubSpot is the bedrock of your entire stack.
-
Marketing Automation Platform: This is your engine for top- and middle-of-funnel activities. Think email nurtures, landing page A/B tests, and lead scoring. It’s how you warm up prospects before handing them off to the sales team.
-
Web Analytics: Tools like Google Analytics are absolutely non-negotiable for understanding what people are doing on your website. They show you where your traffic is coming from, which content resonates, and where users drop off—critical intel for optimizing the front door to your business.
-
Business Intelligence (BI) & Data Visualization: Here's where you tie it all together. BI tools plug into all your different data sources—CRM, marketing automation, ad platforms—to create unified dashboards. This is how you stop looking at individual channel reports and start seeing the big picture.
The Rise of the Customer Data Platform
Today's customer journey is messy. A prospect might see your ad on LinkedIn, visit your website from their laptop, open an email on their phone, and then attend a webinar. How on earth do you connect all those dots into one cohesive story?
This is the exact problem a Customer Data Platform (CDP) was born to solve. A CDP, like Segment or mParticle, acts as a central hub, pulling in data from all your scattered sources and stitching it together into a single, unified profile for each customer. Suddenly, you get that 360-degree view that’s simply impossible with siloed tools.
Think of a CDP as the central nervous system for your customer data. It ensures that marketing, sales, and customer success are all operating from the same complete, accurate playbook. No more guesswork.
How to Evaluate and Choose Your Tools
Picking the right software can feel like a huge undertaking, but you can simplify the process by focusing on a few key criteria. Before you sign any contract, make sure you ask these questions.
-
Integration Capabilities: Does this tool play nicely with your existing systems? You're looking for seamless, native integrations. If a vendor starts talking about complex manual workarounds, that's a red flag. A robust API and pre-built connectors are your best friends here.
-
Scalability: Will this platform grow with you, or will you outgrow it in a year? A tool that’s perfect for a scrappy startup might crumble under the pressure of a company aiming for 10x growth. Think about its ability to handle more data, more users, and more complex use cases down the road.
-
Reporting and Analytics: How easy is it to get meaningful data out of the tool? You need more than just canned reports. Look for customizable dashboards, flexible reporting, and the ability to easily export data for deeper analysis in your BI tool.
-
Total Cost of Ownership: The sticker price is just the beginning. Don't forget to factor in implementation fees, the time it will take to train your team, and any ongoing support or maintenance costs.
Building and refining your tech stack isn't a one-and-done project; it's a continuous process that is fundamental to strong marketing operations. For more on this, you can dig into additional resources on marketing operations strategy. When you invest in the right tools, you empower your team to stop just tracking metrics and start uncovering the strategic insights that actually move the needle.
A Few Common Questions We Hear All the Time
Even with the best framework in place, you’re going to run into questions when you’re in the thick of it. It happens to everyone. Think of this as your field guide for those moments.
Getting these things straight is what builds the confidence you need to actually trust your data and make smart calls. Let’s dig into some of the most common questions we get from SaaS marketers.
How Often Should I Actually Be Looking at My Metrics?
This is a classic. And the answer is definitely not "all the time." The right cadence is all about the metric itself. Trying to check everything every single day is a surefire way to burn out and make knee-jerk decisions based on data that doesn't mean anything yet.
A much smarter way to operate is to set up a tiered schedule.
-
Daily or Weekly Peeks: Save these for your fast-moving, in-the-weeds metrics. I'm talking about things like ad spend, Cost-Per-Click (CPC) on a new campaign, or daily website traffic. These are your canaries in the coal mine—early warnings that something needs a quick look.
-
Monthly Rhythm: This is where you should live for your core business metrics. You’ll want to analyze your Marketing Qualified Leads (MQLs), Sales Qualified Leads (SQLs), and key conversion rates every month. This gives you enough time to see real trends without the daily noise, but it's still frequent enough to fix things before a quarter goes sideways.
-
Quarterly Business Reviews: Now it’s time to zoom out. Your big-picture metrics like Customer Acquisition Cost (CAC), Lifetime Value (LTV), and ROMI are best reviewed quarterly. This is the strategic session where you make the big calls on budget and channel strategy for the next 90 days.
What’s Going on When My Data is Different Across Platforms?
It’s incredibly frustrating but also incredibly common. Google Analytics reports one number, your CRM shows another, and your ad platform has its own version of reality. Why? It usually boils down to a few culprits, like each platform using a different attribution model or having a slightly different definition of a "conversion."
The first thing you have to do is establish a single source of truth. For nearly every SaaS business, that source should be your CRM. It’s the system closest to the cash register, tracking what actually turns into a lead, an opportunity, and a signed deal.
You will drive yourself absolutely bonkers trying to get every single number to match up perfectly across all your tools. Don't. Instead, focus on understanding why they're different and always default to your CRM as the final word on what's impacting the bottom line.
To close the gap, get religious about your tracking. Consistent UTM parameter usage on every single campaign is non-negotiable. This simple discipline lets you trace everything back to its source, which solves a shocking number of data headaches before they even start.
How Can I Possibly Measure Brand Awareness?
I get it—measuring brand-building efforts feels squishy and difficult, but it’s far from impossible. You might not be able to tie a podcast sponsorship directly to a dollar amount, but you can absolutely track indicators that show your brand’s gravity is increasing.
Keep an eye on trends in these key areas:
- Direct Traffic: Are more people typing your URL straight into their browser? That’s a fantastic signal that your brand recall is growing.
- Branded Search Volume: Is the number of people Googling your company name going up? This is a dead-simple way to see if you’re building mindshare in your market.
- Share of Voice: This metric stacks up your brand's mentions online against your competitors. If your share is on the rise, it means you're becoming a bigger part of the conversation in your industry.
These aren't as clean as a CAC formula, but tracking them over time gives you solid, compelling evidence that your top-of-funnel work is actually working. After all, a 2023 study found that the average B2B content engagement rate is under 2%. Strong brand awareness is what convinces someone to pay attention to your message instead of ignoring it—and that’s a real, measurable impact.
At Mick-Mar Inc., we help SaaS companies turn messy data into clear, actionable marketing strategies that actually drive growth. We'll partner with you to build a measurement framework that not only proves marketing's value but also shows you exactly where your next big win is. Discover how we can become your strategic growth partner.